Debugging
Player/camera movement is a core element of almost every game and its quality significantly impacts the overall gaming experience.
Most of the problems fall into these categories:
- Clearly visible for longer period (jitter, character stuck on geometry).
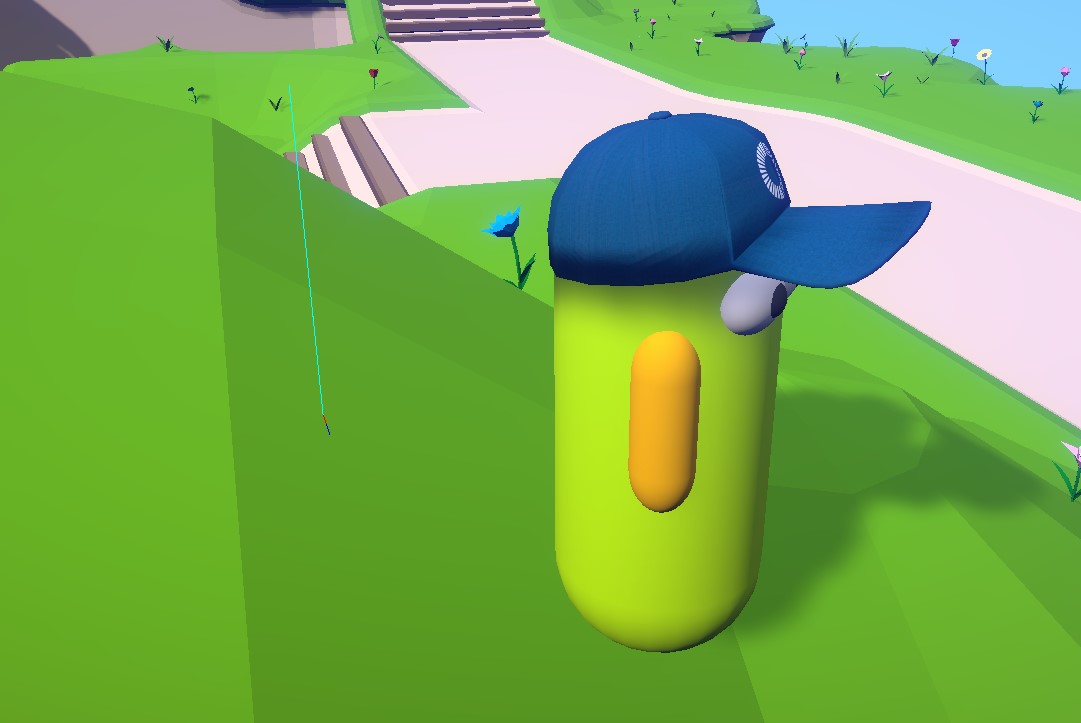
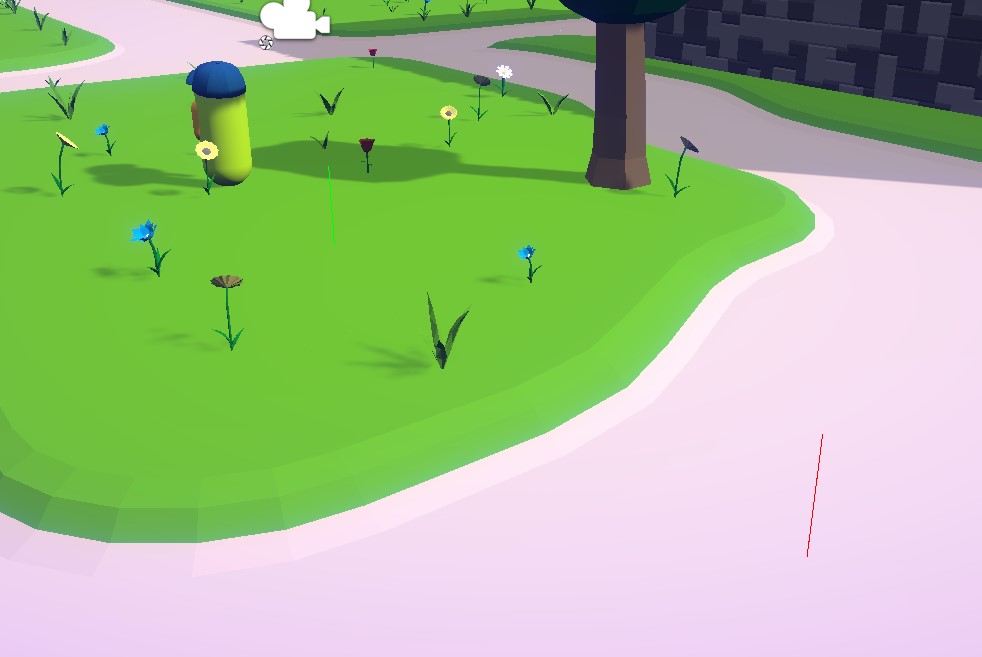
Following images show a character being stuck without a blocking obstacle in front of the character:
- Short, typically less occurring glitches with noticeable impact (incorrect velocity projection after teleport, skill activation while in the air).
Following images show comparison of character snapping - the first one has horizontal slowdown and additional vertical movement over next few frames after teleport:
- Visually not clearly noticeable or hard to describe, with impact on subjective feeling (applying raw input, leaking horizontal movement when walking against slope).
Following images compare raw and smooth mouse input applied to camera rotation, this makes the difference between smooth and butter-smooth gaming experience:
The Advanced KCC provides tools for faster debugging and deep analysis of all problems above.
Runtime Info
KCC component shows additional buttons and information when in play mode:
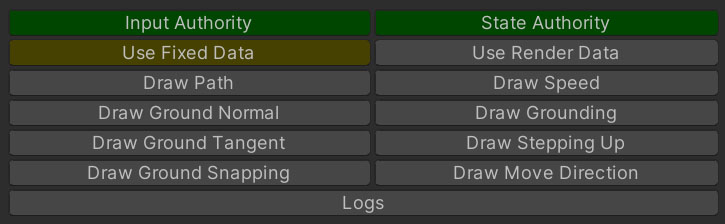
Input Authority- 🟢 Green if the object has input authority.State Authority- 🟢 Green if the object has state authority.Use Fixed Data/Use Render Data- Selector which data is used for drawings and following runtime info values.Drawbuttons are explained below in Drawings section.Logsbutton is used for Logs.
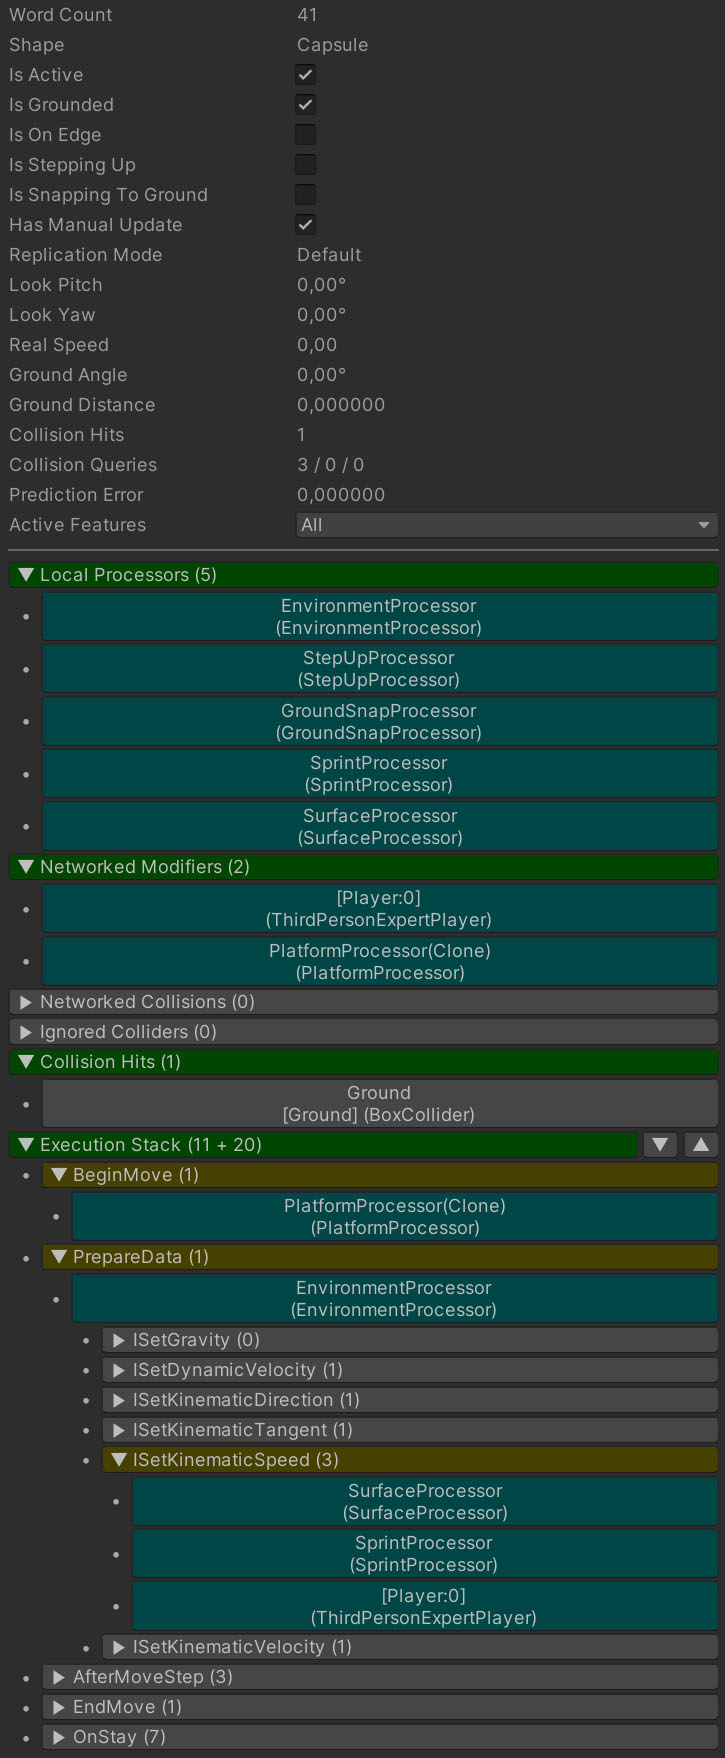
Among self-descriptive properties there are some foldable sections in KCC inspector:
Local Processors- List of active local processors, equals toKCC.LocalProcessors.Networked Modifiers- List of all active modifiers, equals toKCCData.Modifiers.Networked Collisions- List of all active networked collisions (colliders withNetworkObjectcomponent), equals toKCCData.Collisions.Ignored Colliders- List of currently ignored colliders, equals toKCCData.Ignores.Collision Hits- List of all colliders (both networked and non-networked) in last physics query with some metadata, equals toKCCData.Hits.Execution Stack (Stages + Processors)- Last execution order of stages (gray, yellow) and processors (cyan).
All entries with a game object (colliders / processors) are clickable for quick lookup. The entry pattern is Name (Type).
Logs
Logs can be enabled by:
- Selecting KCC game object at runtime and clicking on
Logsbutton in KCC inspector. - Using log methods provided by KCC:
C#
public override void OnStay(KCC kcc, KCCData data)
{
    // Logs current KCC and KCCData state to console.
    kcc.Dump();

    // Enable logs for duration (in seconds) passed as parameter. The output is same as Dump().
    // Useful to debug behavior after activation of an ability so it doesn't spam conosle too much.
    kcc.EnableLogs(1.0f);

    // Logs info message to console with frame/tick metadata.
    kcc.Log("Info");

    // Logs warning message to console with frame/tick metadata.
    kcc.LogWarning("Warning");

    // Logs error message to console with frame/tick metadata.
    kcc.LogError("Error");
}
The message format is following:
[Time] [Frame][Tick][Name] Message
where
Time- Default Unity log timestamp.Frame- Engine frame number (Time.frameCount)- Red - Odd frame.
- Blue - Even frame.
Tick- Fusion simulation tick (Runner.Tick)- Red - Resimulation is active.
- Yellow - Forward simulation is active.
- Green - Render is active.
Name- Name of the KCC game object.Message- Custom message.
Following image shows color-coded output from Unity console using kcc.Log("Info");.
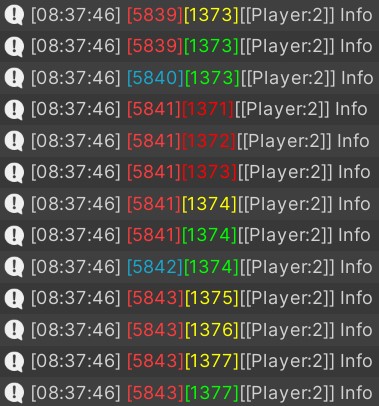
What you can see here?
- Frame
5839- Executed simulation of 1 forward tick (yellow) + render (green). - Frame
5840- Executed only render (no enough time passed to simulate next fixed tick). - Frame
5841- New data arrived from the server, ticks1371,1372and1373are resimulated (red), executed simulation of 1 forward tick + render. - Frame
5842- Executed only render (no enough time passed to simulate next fixed tick). - Frame
5843- Executed simulation of 3 forward ticks (there was a hiccup last frame probably) + render.
Drawings
Drawings can be enabled by:
- Selecting KCC game object at runtime and clicking on
Drawbuttons in KCC inspector.
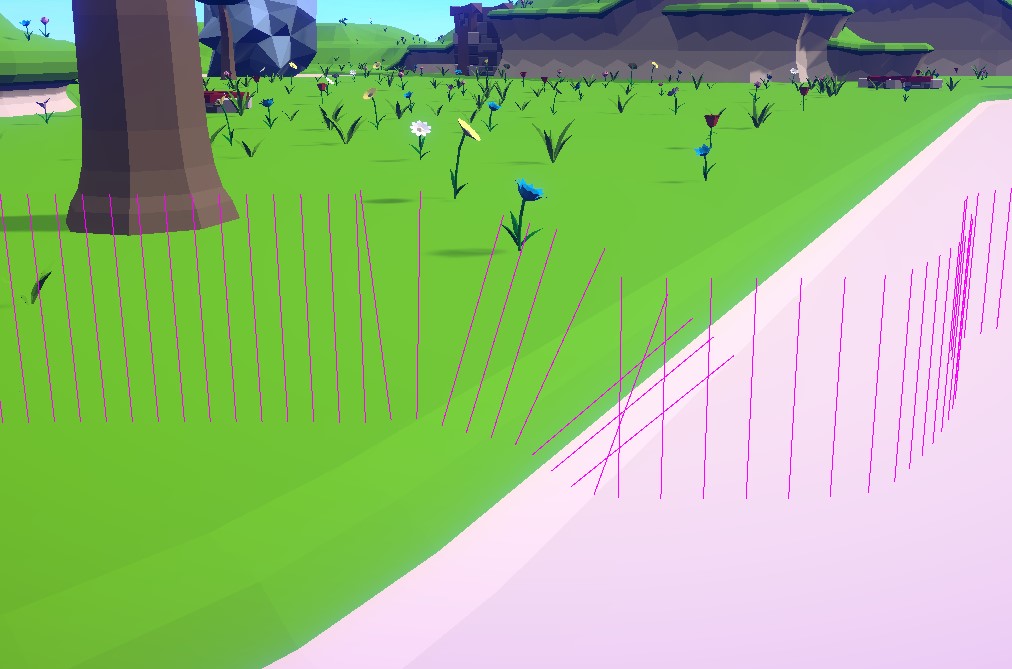
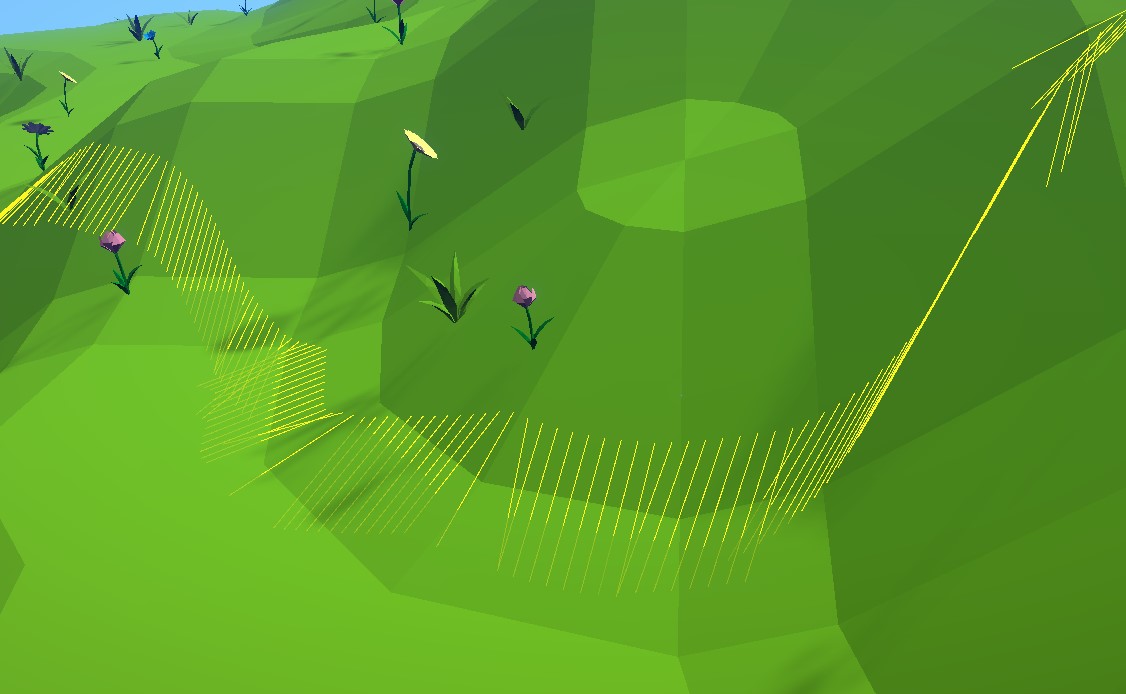
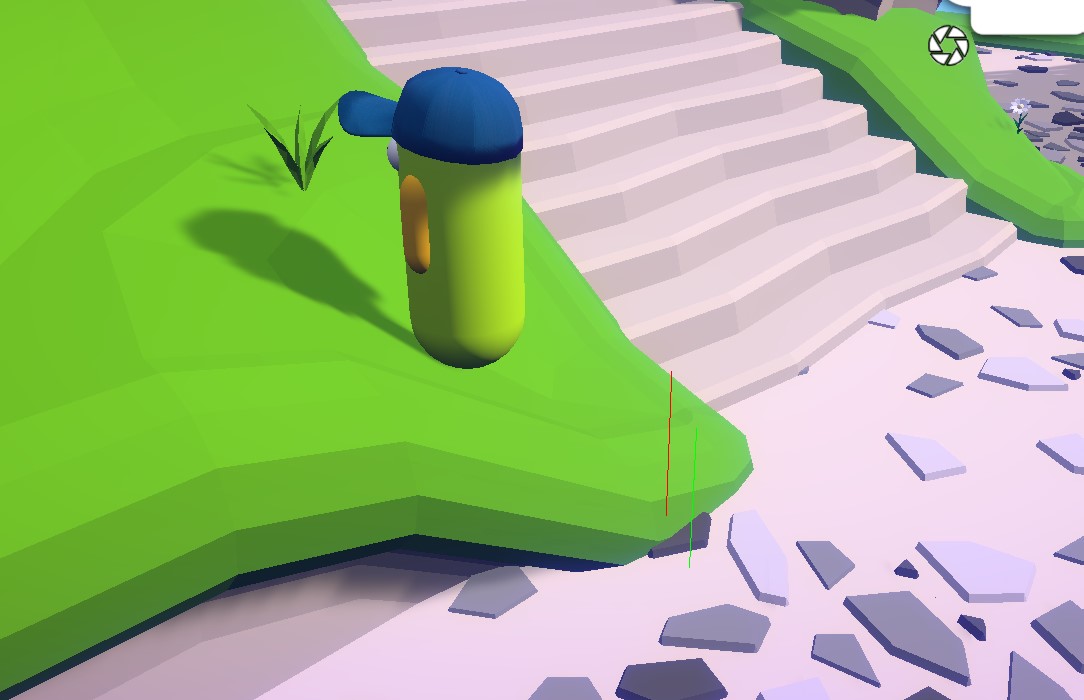
Draw Path- Shows path in fixed and render updates.Red Point- Position in fixed update.Green Point- Position in render update.Red Line- Connects base and target position in fixed update.Green Line- Connects base and target position in render update.Purple Line- Detected prediction error - last render position vs expected position between fixed positions with the same timestamp.Blue Line- Applied prediction error on latest simulation state.Yellow Line- Prediction correction.
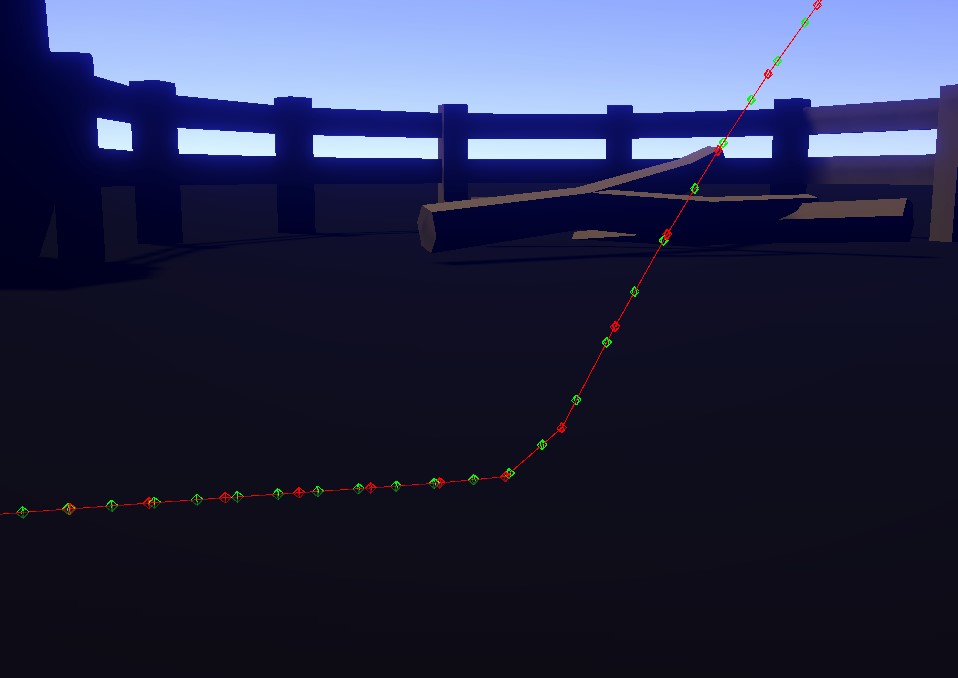
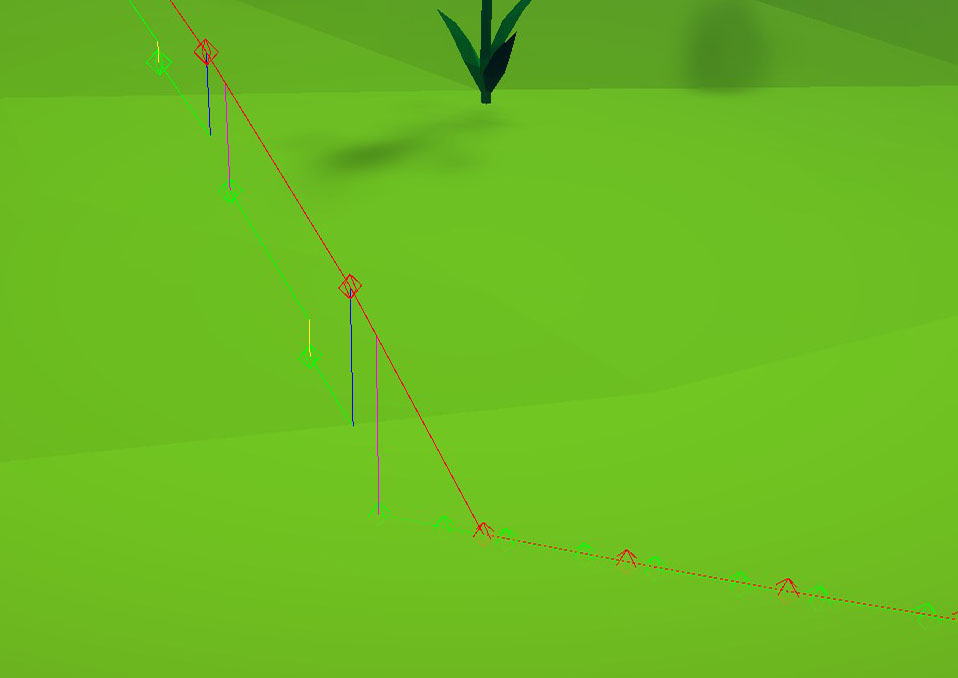
⚠️ Notice positions in render-interpolated path - changes in direction may result in undesired effect (in this case smoothed landing instead of hard ground hit).
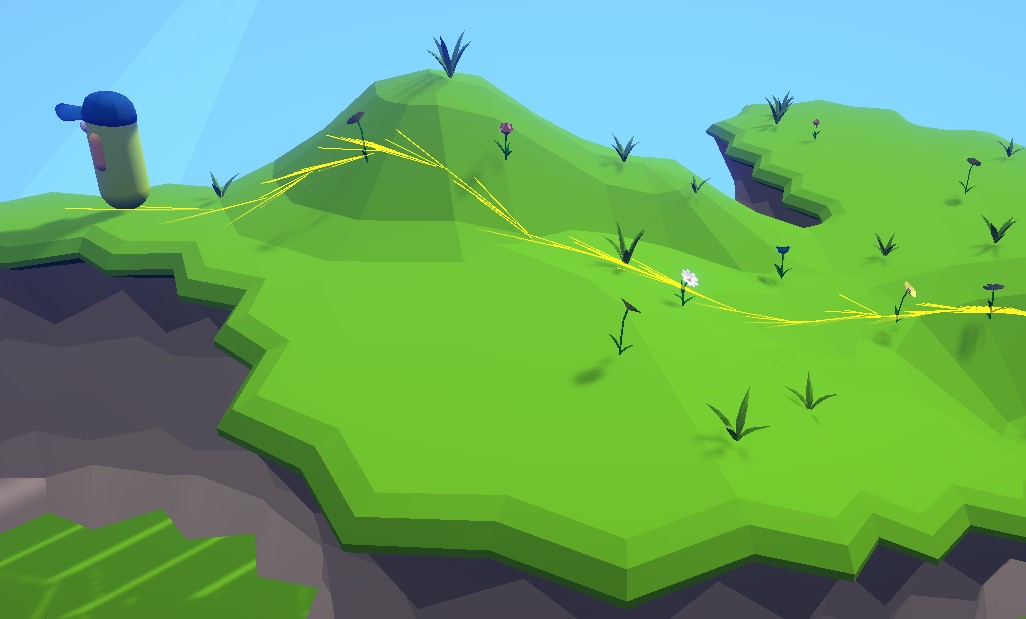
Draw Speed- Shows speed of the character (the vector size can be scaled in inspector). Useful for relative comparison of speed when moving on various surfaces / through obstacles / detect undesired slowdowns.
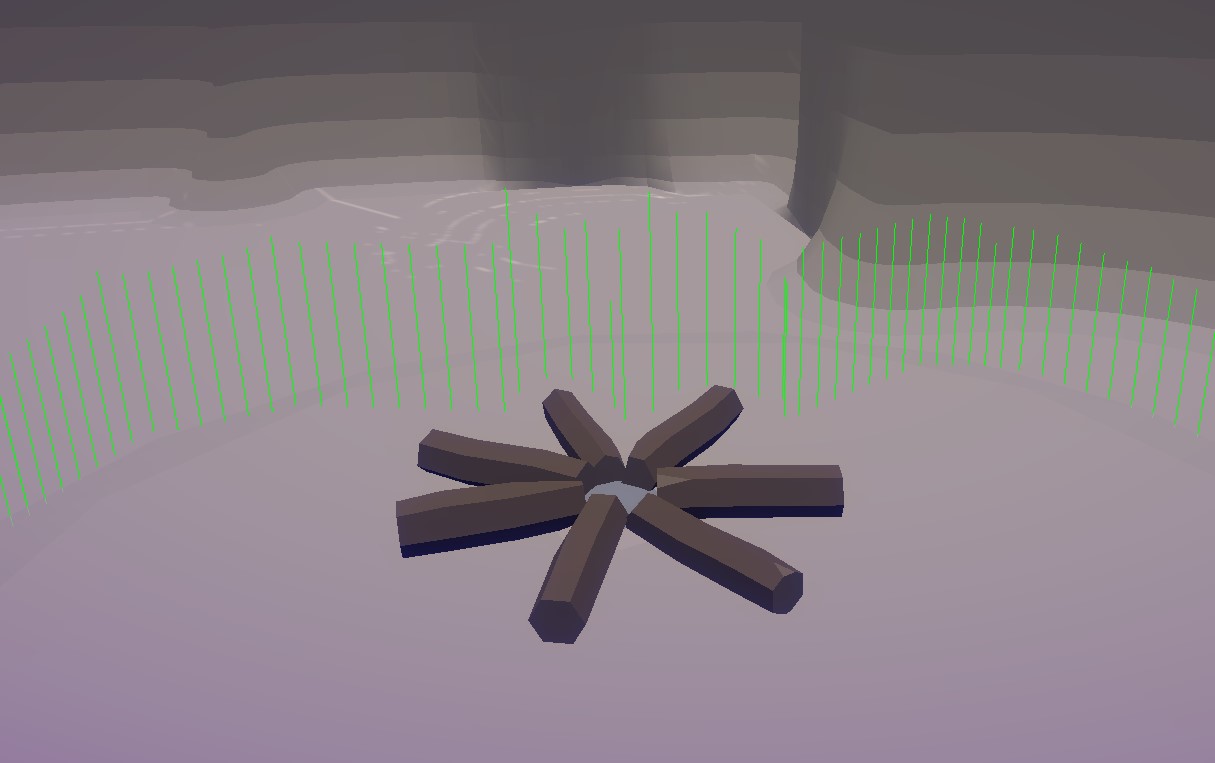
Draw Ground Normal- Shows ground normal. This can reveal errors in movement calculations.
Draw Ground Tangent- Shows ground tangent. This can reveal errors in movement calculations.
Draw Ground Snapping- Shows ground snapping events (the character doesn't fall fast enough to keep grounded state and is snapped down). This happens usually when walking over bumps or on a steeper slope.
Draw Grounding- Shows grounding events. This can help revealing problems with character unexpectedly losing grounded state which usually impacts animations.Green- Grounded.Red- Ground lost.
Draw Stepping Up- Shows step-up events. With this you can quickly verify if the step-up feature is responsible for character (not) traversing obstacles which should/shouldn't be traversable.Green- Step-up started.Red- Step-up ended.
Draw Move Direction- Shows move direction. This can help identifying undesired movement on various surfaces and reveal errors in movement calculations.
- Using draw methods provided by KCC. These are useful for debugging custom one-time events.
C#
public override void OnStay(KCC kcc, KCCData data)
{
    // Draw a color-coded line for 10 secons at current KCC position.
    // Red    = resimulation tick.
    // Yellow = forward simulation tick.
    // Green  = render update.
    kcc.DrawLine(10.0f);

    if (kcc.IsInForwardUpdate == true)
    {
        // Draw a blue line for 10 secons at current KCC position.
        kcc.DrawLine(Color.blue, 10.0f);
    }
}
Recorders & Graphs
Although tools for real-time debugging are essential, it is also important to have tools for recording and retrospective analysis.
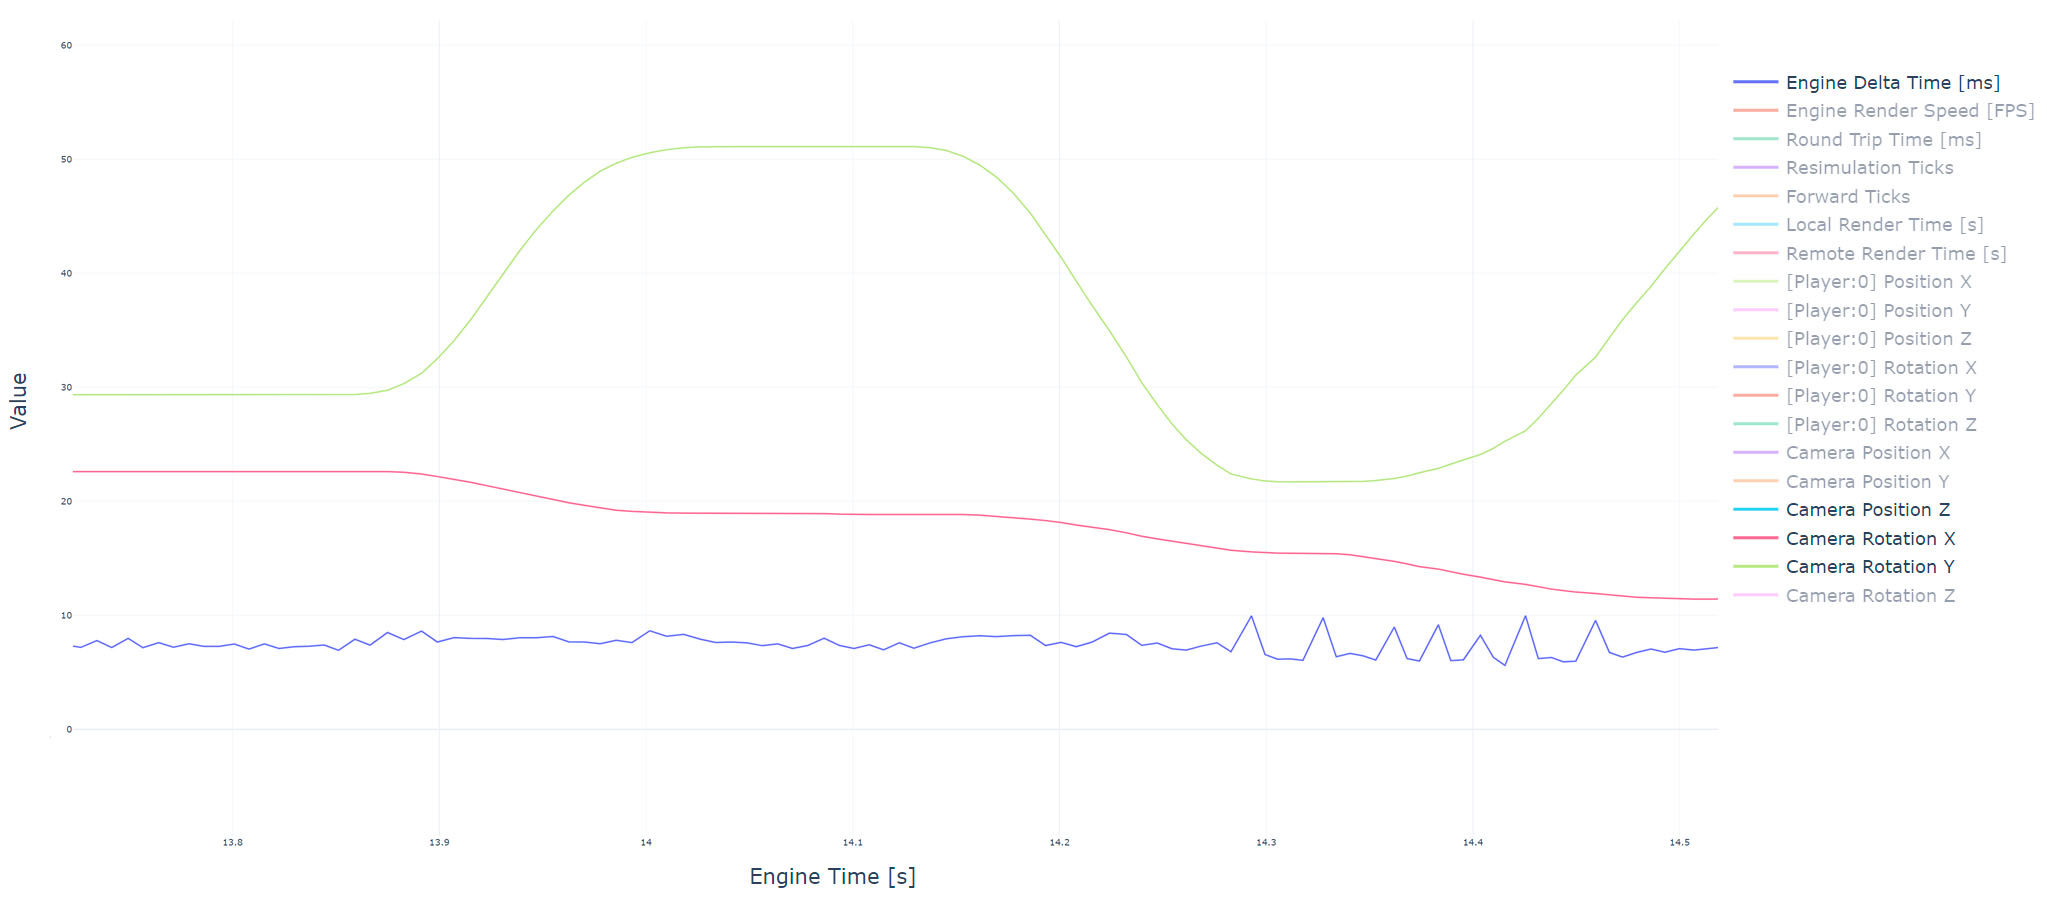
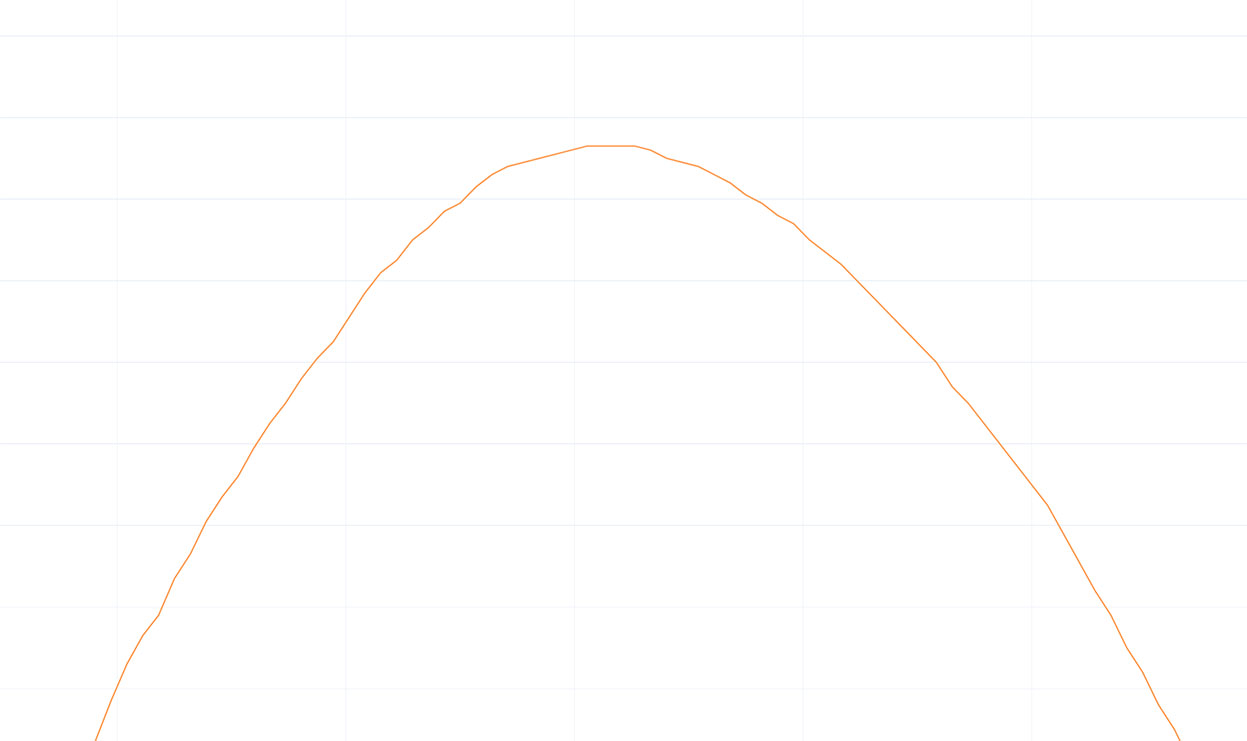
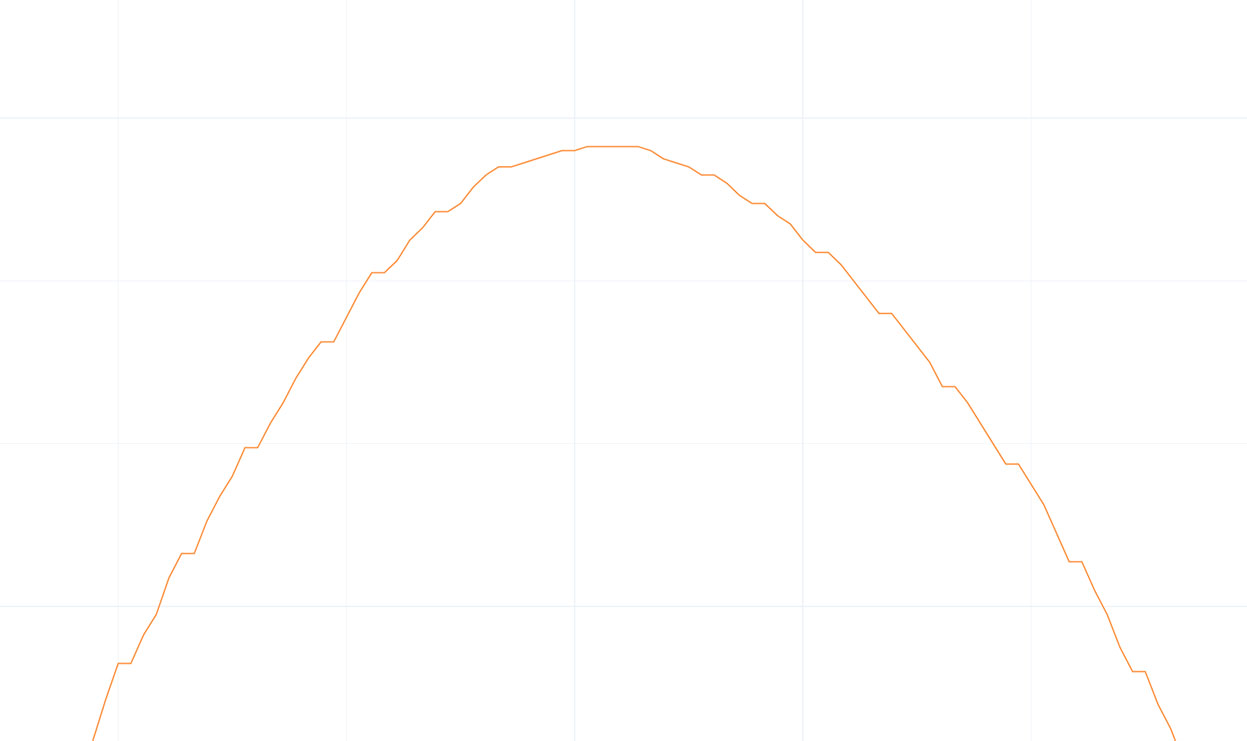
Following image shows recorded session and zoomed detail. The graph is fully explorable and easy to read.
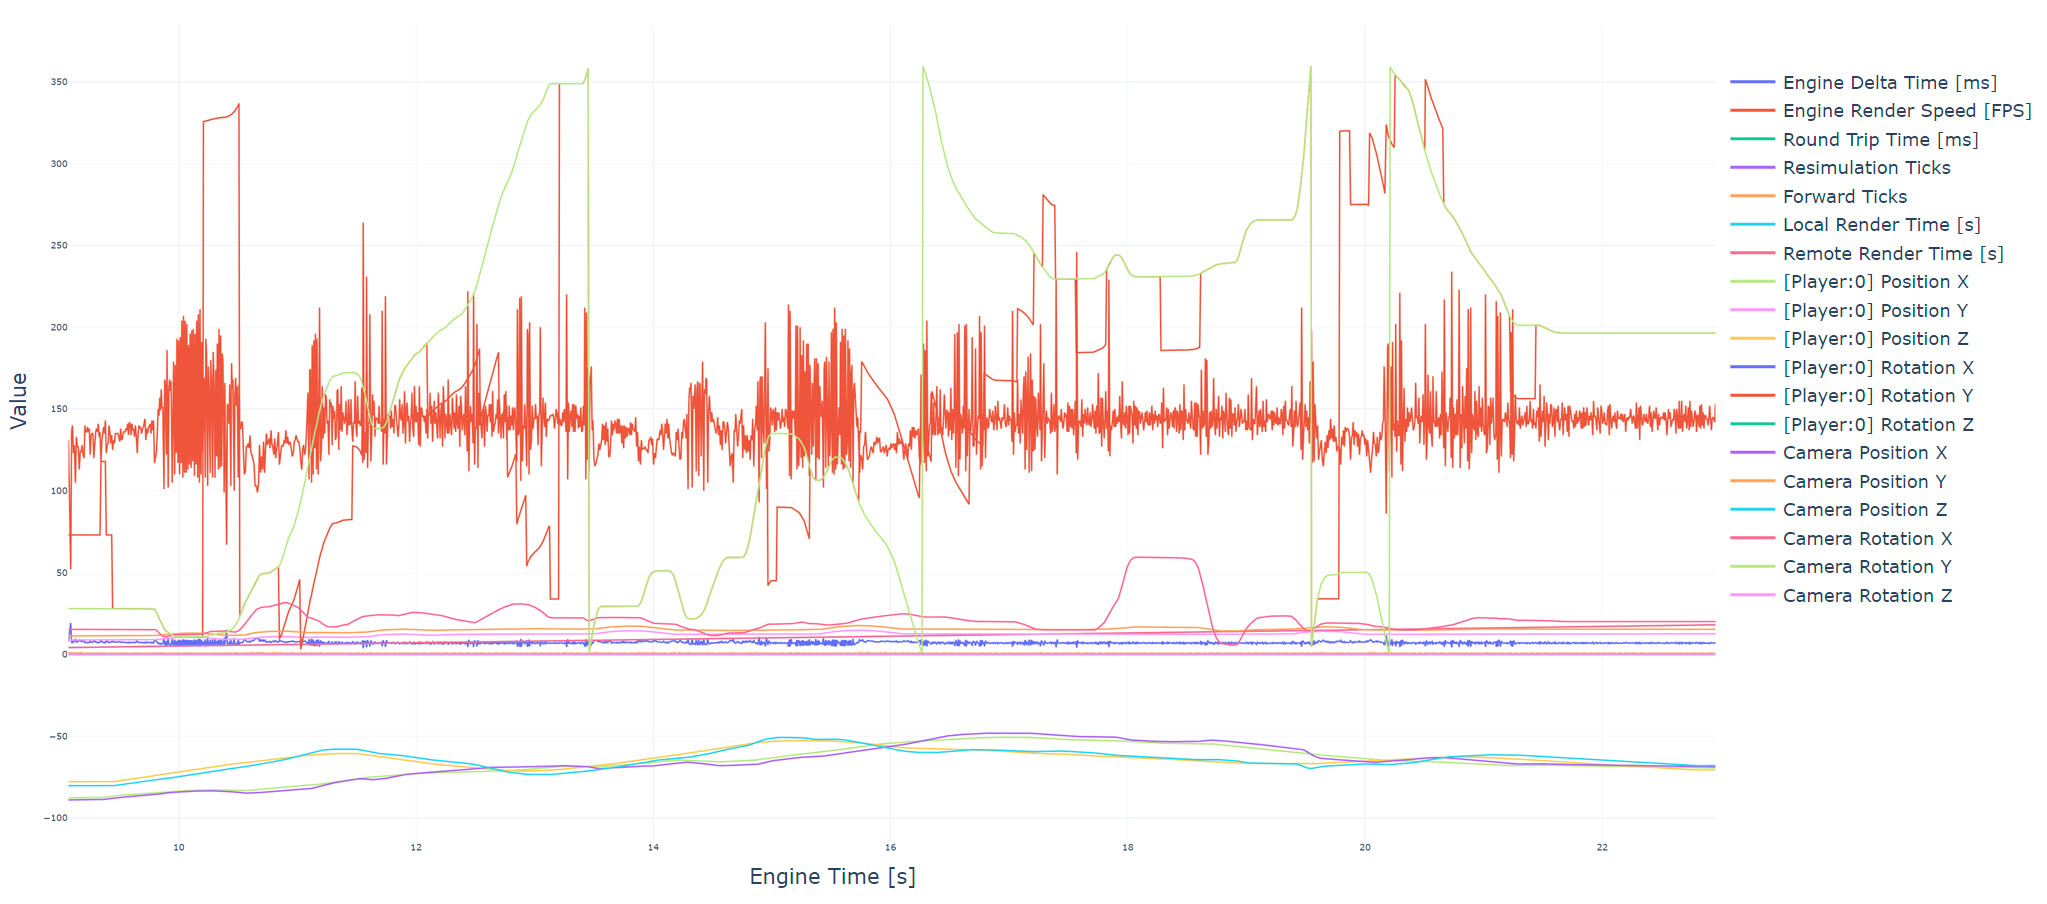
These are some main benefits:
- ✅ It is possible to quickly inspect graphs from a high-level and spot some local problems.
- ✅ Recordings can be stored and later compared with those grabbed from other builds. This way it's easier to identify bugs introduced in new release.
- ✅ You can remotely enable recording for a specific user with issues. And check for some unusual values thoughout gameplay session.
- ✅ Testers can automatically record all sessions with production build and attach recordings to bug reports.
The Advanced KCC provides following recorder components:
KCC Recorder- RecordsKCCandKCCDataproperties.Camera Recorder- RecordsCamera.mainposition and rotation.Transform Recorder- RecordsTransformposition and rotation.Player Recorder- RecordsTransformandCamera.mainposition and rotation.
Following image shows recorders on FirstPersonExpertPlayer prefab from Sample Project.
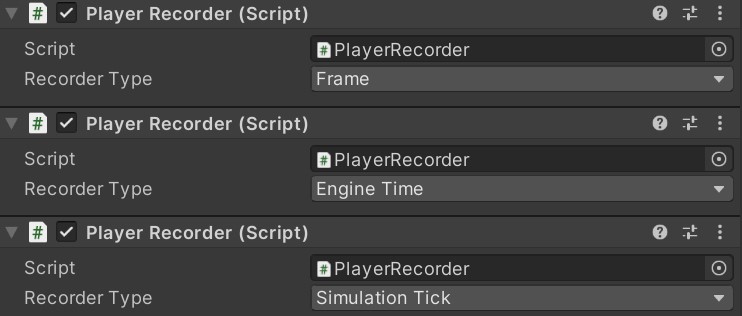
Each recorder creates a unique file upon activation. Files are create at root project folder (when playing from Editor) or directly in build folder.
⚠️ It's super important to set correct recorder type to see values from correct perspective. Available values are:
Frame- X axis in graph is a linear representation ofTime.frameCount- file ends with (Frame).Engine Time- X axis in graph is a linear representation ofTime.unscaledTime- file ends with (EngineTime).Monitor Time- X axis in graph is a linear representation of simulated monitor time - file ends with (MonitorTime).Simulation Tick- X axis in graph is a linear representation ofRunner.Tickin forward simulation - file ends with (SimulationTick).
⚠️ Monitor Time is a special recorder type which simulates specific display refresh rate and represents values that are presented (what you actually see), not the data rendered in graphics card buffer. Movement that is perfectly smooth in frame buffers doesn't guarantee it is perceived as smooth by player eyes.
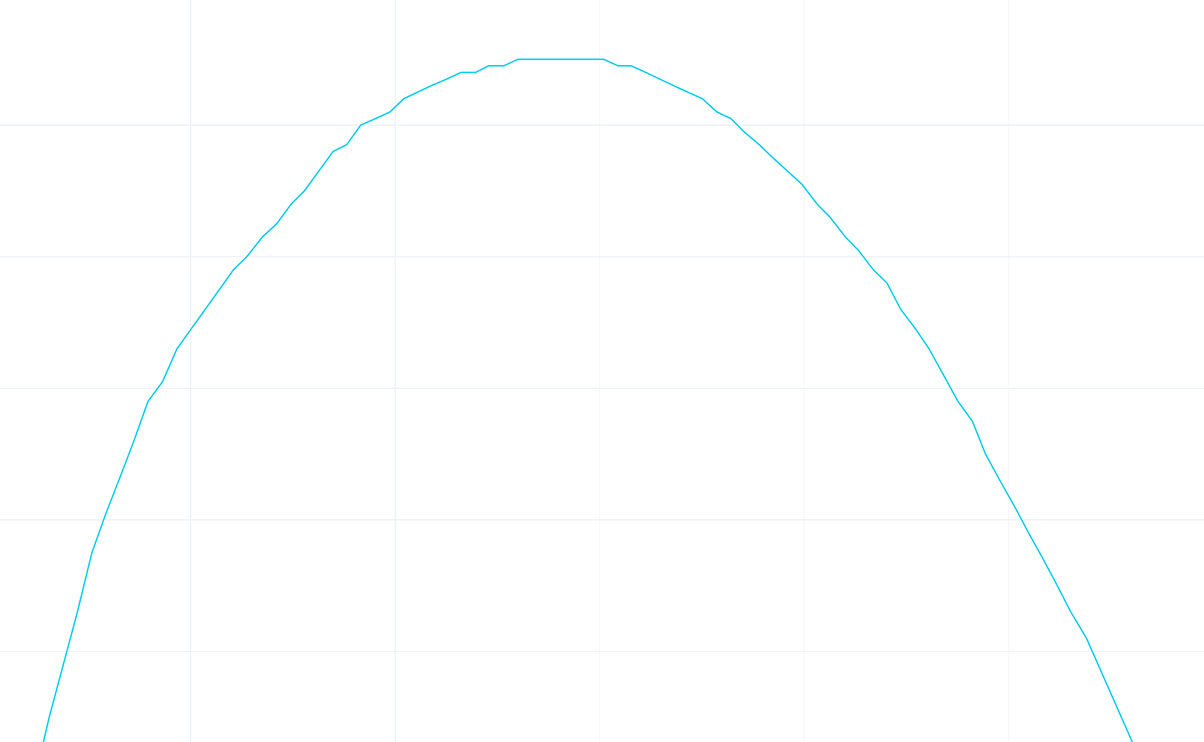
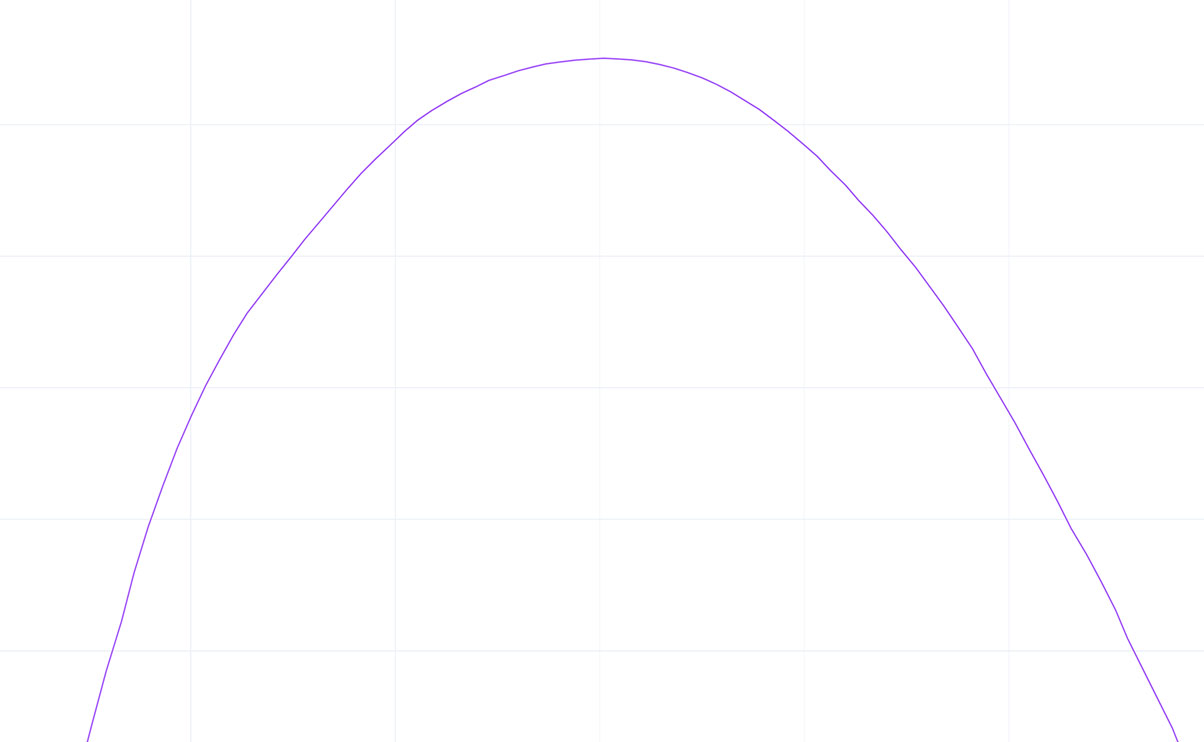
Following images compare camera look rotation in 288 FPS gameplay presented to the player on 288Hz monitor and 360Hz monitor. It is clearly noticeable when playing.
To analyze recorded files:
- Install Python.
- Install following Python packages:
pandasplotlychart_studio
- Make some recordings using recorder scripts mentioned above.
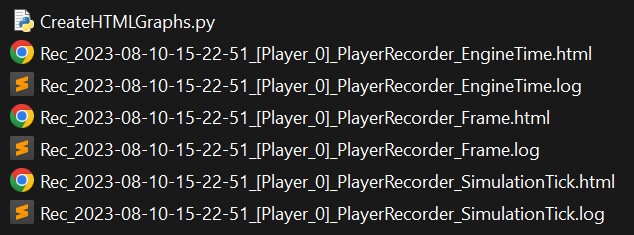
- Copy
Assets\Photon\FusionAddons\KCC\Utilities\Recorders\CreateHTMLGraphs.pyscript to the folder with recorded files. - Run the python script and wait until all HTML files are created.
Creating custom recorder:
C#
[DefaultExecutionOrder(31510)]
public class CustomRecorder : StatsRecorder
{
    protected override void GetHeaders(ERecorderType recorderType, List<string> headers)
    {
        // Write headers.
        headers.Add($"Value Name");
    }

    protected override bool AddValues(ERecorderType recorderType, StatsWriter writer)
    {
        // Write values.
        writer.Add($"{0.0f:F4}");

        return true;
    }
}
Running the recorder:
C#
public class Player : MonoBehaviour
{
    public CustomRecorder _recorder;

    public void SomeMethod()
    {
        // Starts recording with default settings.
        _recorder.SetActive(true);

        // Starts recording with specific type.
        _recorder.SetActive(ERecorderType.EngineTime);

        // Stops recording, flushes all values and closes the file.
        _recorder.SetActive(false);
    }
}