Profiling
Introduction
Profiling is generally a good tool for finding the relative performance between parts of code, and allowing developers to drill down to hot spots. But it's not useful for finding absolute performance measures, because profiling tools, especially Unity's, affect performance with their overhead.
The recommended performance analysis path is:
- Measure simulation times, rendering times, etc. using a Quantum Release build (quantum solution) and an IL2CPP Unity build only the Quantum Graph Profiler attached to give overall numbers over time;
- Make sure to either set either zero or a high value into
DeterministicConfig.ChecksumIntervalas frequent checksums have an impact on performance; - Then, with the rough idea where to look (is it the simulation, is it rendering, etc.), follow up with a profiling session using the Unity Profiler or Quantum Task Profiler.
Keep in mind that a Quantum debug build can be 5x slower than a release build.
As well as that a debug+mono build can be 10x slower that a release+il2cpp build.
Unity Profiler
Quantum performance stats are integrated into the Unity Profiler and are started by default inside the QuantumRunner script.
C#
Quantum.Profiling.HostProfiler.Init(..)
You can add custom sections in your Quantum simulation code by this know Unity Profiler pattern:
C#
HostProfiler.Start("Foo");
{
  HostProfiler.Start("Bar1");
  // do work
  HostProfiler.End();

  HostProfiler.Start("Bar2");
  // do work
  HostProfiler.End();
}
HostProfiler.End();
With the most current Quantum SDK versions (2.1) Quantum also supplies data for the Timeline profiler in Unity. Quantum only provides profiling data in Debug configuration.
Quantum Task Profiler
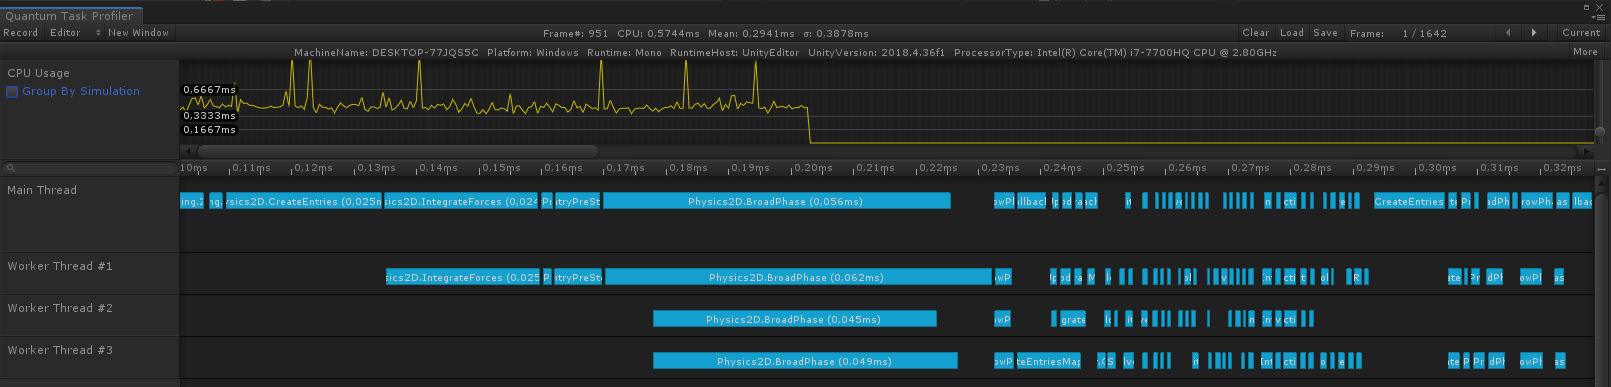
The Quantum Task Profiler is a custom and standalone graphical performance profiler for Unity similar to the Unity Timeline profiler.
It can run with debug and release Quantum dlls.
- Start the game
- Open
Tools > Quantum > Window > Task Profiler - Toggle the
Recordbutton
Remote Profiling
Similar to the Unity Profiler an app running on a remote device connects to the Unity Editor via UDP inside the same local network.
Make sure to configure the firewall of the machine running the Unity Editor to unblock UDP port 30000 and to disable rules that block every connection for a specific Unity Editor installation.
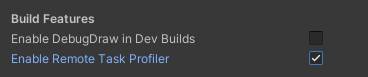
To enable it select the QuantumEditorSettings asset and toggle on Enable Remove Task Profiler. It will add the scripting define QUANTUM_ENABLE_REMOTE_PROFILER to the current selected build platform. The define has to exist for the build platform used to create a build that is profiled.
Quantum Graph Profiler
The Quantum Graph profiler is a tool that can be integrated into a game scene to display game performance and network state graphs. This profiler is part of the Quantum SDK and can be found in Assets\Photon\Quantum\Runtime\GraphProfilers.
To install: Drag the prefab QuantumGraphPrefabProfilers into the scene.
Real-Time Profiling
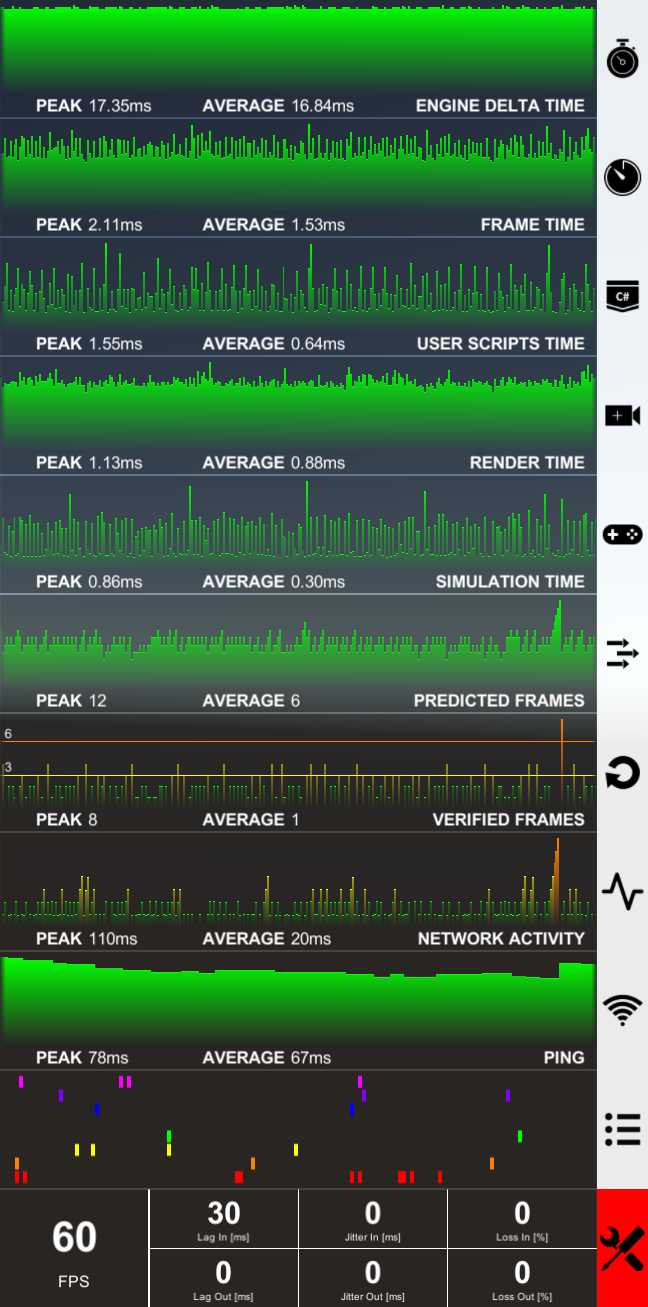
These runtime graphs help tracking the overall performance of the game and the Quantum simulation under various network conditions. The graphs and their values are based on the Unity update rate where each value equals the accumulated time/count/etc... in a single Unity frame.
The profiler offers graphs for:
Engine Delta Time: equalsTime.unscaledDeltaTimebetween Unity frames. SometimesEngine Delta Timemay not reflect the target FPS, to fix this setQualitySettings.vSyncCount = 0;Frame Time: all scripts logic including Unity internal and rendering, but excluding the wait for end of frame;User Scripts Time: the time to runFixedUpdate()+Update()+LateUpdate();Render Time: equals time from lastLateUpdate()until the end of render;Simulation Time: equalsQuantumRunner.Default.Game.Session.Stats.UpdateTime;Predicted Frames: the amount of predicted Quantum frames simulated in a Unity frame equalsQuantumRunner.Default.Game.Session.PredictedFrames;Verified Frames: the amount of verified Quantum frames simulated in a Unity frame;Network Activity: the time since the last data transmission from the server;Ping: network peer round trip time (RTT);Markers: up to 8 custom boolean can track values using markers. Each marker is represented by unique color; by defaultRed = input replaced by serverandOrange = checksum calculated.
A Note on Markers
For better legibility, the markers graph is running 2x faster than the others. This can be adjusted via the Samples property on the Profilers prefab.
Multiple instances of MarkersProfiler are supported:
- Get an instance by name
MarkersProfilerprofiler =MarkersProfiler.Get(GAMEOBJECT_NAME); - Call
profiler.SetMarker(INDEX);
Other tools
The real-time profiling tool also contains other (more basic) tools for:
- changing target FPS (
Application.targetFrameRate); and, - to simulate network conditions (lag, jitter, loss).
These are useful to quickly simulate different rendering speeds and bad networks. The effects can be seen immediately in graphs (predicted frames, simulation time, ...).
N.B.: When simulating network loss, set values carefully. Use 1-3% to simulate loss on network and higher values to simulate local loss (e.g. bad connection to router behind 3 walls).
Back to top