Photon Counters
Photon makes use of Windows Performance Counters as well as custom in-memory counters to track server performance and statistics, e.g. CPU load, memory usage, current connection count, operation execution time, etc.
To display these counters either Windows Performance Monitor or any other external time series database system can be used.
Photon is able to publish its counter values via UDP, PGM or HTTP.
Photon performance counters are easily extensible and the display options can be fully customized.
Performance Counters
In-Memory Counters
Photon's applications are using in-memory performance counters to track application-specific statistics, e.g. the number of current games.
These counters don't show up in the Windows Performance Monitor.
Windows Performance Counters
To track performance data, Photon relies on native
Windows Performance Counters instead.
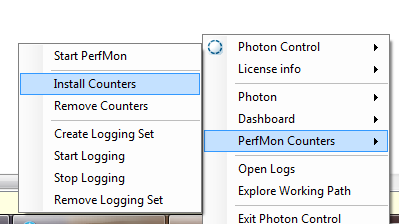
If you want to make use of these counters, you need to install them before you start Photon.
This can be done in Photon Control:
or by entering this command from your binaries deploy folder (same folder as PhotonControl):
./PhotonSocketServer.exe /installCounters
Besides make sure you have Windows Peformance Counters enabled in the configuration file of your application.
To do so, set EnablePerformanceCounters to True as follows:
XML
<configuration>
  <applicationSettings>
    <!-- other settings -->
    <Photon.LoadBalancing.Common.CommonSettings>
      <!-- other settings -->
      <setting name="EnablePerformanceCounters" serializeAs="String">
        <value>True</value>
      </setting>
      <!-- other settings -->
    </Photon.LoadBalancing.Common.CommonSettings>
    <!-- other settings -->
  </applicationSettings>
</configuration>
Check Windows Performance Monitor to see the installed counters:
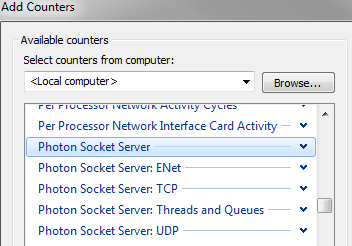
Photon is writing data to these counters automatically once it is started.
Usage
Overview
Photon Server uses Windows Performance Counters and in-memory Photon Counters to publish statistics.
Photon native Core writes statistics to Windows Performance Counters only.
They can be read and published by CounterPublisher .NET application to any other endpoint.
Usually, Photon Server carries a few .NET applications on board.
Every Photon .NET application implementing Photon.SocketServer.ApplicationBase contains a default set of counters that can be published through out configurable Photon.SocketServer.Diagnostics.CounterPublisher singleton.
Publishing of .NET application statistics can be enabled in the configuration file of your application.
Publishing rate, used protocol, receiving endpoint and additional options can be configured in place.
Default publisher supports various kinds of protocols.
They can be extended by the plugins.
It is possible to extend counters samples made by the publisher, specifying additional counter schemas in the configuration.
Architecture
Photon native Core writes statistics to Windows Performance Counters only.
Every Photon .NET application implements Photon.SocketServer.ApplicationBase.
The latter uses Photon.SocketServer.Diagnostics.CounterPublisher singleton to sample and publish statistics to the world.
The publisher is configurable with the <Photon> section of the application configuration typed Photon.SocketServer.Diagnostics.Configuration.PhotonSettings, Photon.SocketServer.
The Publisher consists of a "Sampler" and a "Sender".
The Sampler simply reads all the registered counters (from any source that implements ExitGames.Diagnostics.Counter.ICounter interface) and aggregates them during the time.
The Sender uses implementation of ExitGames.Diagnostics.Monitoring.Protocol.ICounterSampleWriter interface to actually send aggregated data to the configured endpoint.
Sender abstracts transport and protocol levels from the Publisher.
There is a default abstract implementation of ICounterSampleWriter to help developers to create new plugins: PhotonBinaryWriterBase.
Configuration
Photon Counters can be configured for any Photon Server application via its configuration file.
The configuration file must contain at least the following lines to have counter publishing enabled with default behaviour:
XML
  <configSections>
    <section name="Photon" type="Photon.SocketServer.Diagnostics.Configuration.PhotonSettings, Photon.SocketServer" />
  </configSections>

  <Photon>
    <CounterPublisher enabled="True" />
  </Photon>
It is important to stick with <Photon> section alias for Photon.SocketServer.Diagnostics.Configuration.PhotonSettings type, because it is an internal name reserved for default configuration of application publisher instance.
List of Settings
Attributes of <CounterPublisher>:
enabled: OPTIONAL.
Default: "False".
Toggles publishing of counters.
Add this and set it to "True" to publish counters.senderType: OPTIONAL.
Specifies assembly-qualified name of the type for the custom settings class for the attributes of<Sender>.updateInterval: OPTIONAL.
Default: 10.
Sampling rate.
In seconds.addDefaultAppCounter: OPTIONAL.
Default: "True".
Controls whether to include default application counters into the publisher by default.
If disabled, CounterPublisher will omit defaultApplicationBasecounters
Attributes of <Sender> (ExitGames.Diagnostics.Configuration.CounterSampleSenderSettings):
endpoint: REQUIRED.
Default: "http://127.0.0.1".protocol: OPTIONAL.
Default: "PhotonBinary".
The application level protocol.
Case insensitive ProtocolType (PhotonBinary,GraphiteText,InfluxDB090GraphiteText,StatsDText), or custom Writer type implementation.senderId: OPTIONAL.
Default: "".
The ID of the sender that will be sent with the counter data.
"{0}" occurrences -if any- will be replaced withEnvironment.MachineName.initialDelay: OPTIONAL.
Default: 10.
Period of time to delay first data publishing.
In seconds.sendInterval: OPTIONAL.
Default: 10.
The publish interval.
In seconds.maxQueueLength: OPTIONAL.
Default: 120.
How many packages should be enqueued for republishing if an error occurred during publishing.maxRetryCount: OPTIONAL:
Default: -1.
How many error can occur during publishing before the counter publishers stops publishing.
If a value equal or less than than zero is specified the counter publisher will never stop if an error occurred.
There are also specific settings for per application protocol.
Transport protocols
Supported transport protocols:
- UDP
- HTTP (or HTTPS)
- PGM
- Any other custom transport provided by third party clients. TCP is not supported yet.
Transport protocol can be configured through "endpoint" property of ExitGames.Diagnostics.Configuration.CounterSampleSenderSettings.
These transport types are defined by ExitGames.Diagnostics.Configuration.TransportType.
"endpoint" property format is defined by the specification of default constructor of System.Uri type.
Examples: "udp://255.255.255.255:40001" or "https://localhost:4000".
Application Protocols
Photon "CounterPublisher" can write data to the wide set of time series databases.
Actual data publishing done via certain implementation of ExitGames.Diagnostics.Monitoring.Protocol.ICounterSampleWriter.
Usually, for every specific writer, there is corresponding settings class available in ExitGames.Diagnostics.Configuration namespace.
Sender default settings implemented by ExitGames.Diagnostics.Configuration.CounterSampleSenderSettings.
"ExitGamesLibs" contains implementation for:
- Photon binary protocol
- Graphite
- InfluxDB 0.9.0 / Graphite UDP with tags
- StatsD
"CounterPublisher" can use any external implementation of the ICounterSampleWriter.
Thus, it can write to any database via custom Writer implementation.
There are also 2 custom separate implementations of the ICounterSampleWriter enabling support for:
- Amazon AWS CloudWatch
(CounterPublisher.AWS.CloudWatchplugin) - NewRelic Platform
(CounterPublisher.NewRelicplugin)
Those custom external implementation can be configured through stating custom "protocol" type, i.e.
XML
  <Photon>
    <CounterPublisher enabled="True" senderType="ExitGames.Diagnostics.Configuration.AWSCloudWatchSettings, CounterPublisher.AWS.CloudWatch">
      <Sender protocol="ExitGames.Diagnostics.Monitoring.Protocol.AWS.CloudWatch.AWSCloudWatchWriter, CounterPublisher.AWS.CloudWatch" />
    </CounterPublisher>
  </Photon>
Important thing is, usually custom protocol implementation requires setting up of specific configuration properties.
It can be done by specifying writer specific "senderType" property class type (like in the example above).
Counters schemas
"CounterPublisher" read and write registered counters.
To register counter, there is a special method CounterPublisher.AddCounter(ICounter counter, string name).
Usually, counters are grouped by some logical reason into classes like Photon.SocketServer.Diagnostics.PhotonCounter.
"PhotonCounter" provides default counters for any ApplicationBase based .NET application:
- AvrgOpExecTime
- EventsSentCount
- EventsSentPerSec
- MessagesSentCount
- MessagesSentPerSec
- RawMessagesSentCount
- RawMessagesSentPerSec
- InitPerSec
- OpReceiveCount
- OpReceivePerSec
- OpResponseCount
- OpResponsePerSec
- OperationsFast
- OperationsMaxTime
- OperationsMiddle
- OperationsSlow
- SessionCount
Counters are static readonly fields with attribute "PublishCounter" which can define some additional properties like another name, or something.
C#
    public static class PhotonCounter
    {
        [PublishCounter("AvrgOpExecTime")]
        public static readonly AverageCounter AverageOperationExecutionTime = new AverageCounter();

        //...
    }
Counter classes are registered in "CounterPublisher" with CounterPublisher.AddCounterClass or CounterPublisher.AddStaticCounterClass like this:
C#
    if (PhotonSettings.Default.CounterPublisher.Enabled)
    {
        if (PhotonSettings.Default.CounterPublisher.AddDefaultAppCounter)
        {
            CounterPublisher.DefaultInstance.AddStaticCounterClass(typeof(PhotonCounter), this.ApplicationName);
        }

        CounterPublisher.DefaultInstance.Start();
    }
Usually all counter classes are paired with special schema classes which includes logical namespaces and counters names (Photon.CounterPublisher.SocketServerCounterSchema):
C#
namespace Photon.CounterPublisher
{
    public static class SocketServerCounterSchema
    {
        public static class Common
        {
            public static readonly string CategoryName = "Photon Socket Server";

            public static readonly string BuffersInUseCounter = "IO Buffers In Use";

            //...
        }

        public static class Enet
        {
            public static readonly string ACKsInCounter = "Acknowledgements in";

            public static readonly string ACKsInPerSecondCounter = "Acknowledgements in/sec";

            //...
        }

        //...
    }
}
Thus, counter class will describe its counters in terms of its schema:
C#
namespace Photon.CounterPublisher
{
    [CounterSet(Name = "Photon")]
    public static class SocketServerCounter
    {
        /// <summary>
        /// The bytes in per second counter.
        /// </summary>
        [PublishCounter("BytesInPerSecond")]
        public static readonly PerformanceCounterReader BytesInPerSecondCounter =
            CreateCounterReader(Schema.Common.CategoryName, Schema.Common.BytesInPerSecondCounter);

        //...

    }
}
Finally, "CounterPublisher" can be configured to read and write any additional counters via <Counters/Schema> configuration element.
XML
  <Photon>
    <CounterPublisher ... >
      <Sender  ... />
        <Counters>
          <Schema namespace="TestNamespace" type="Photon.CounterPublisher.SystemCounter, CounterPublisher" />
        </Counters>
    </CounterPublisher>
  </Photon>
It is important, to choose metrics names wisely.
Use following rules for naming conventions:
- PascalCase matching
[a-zA-Z0-9]+symbol set
1.1. "Per" suffix then format should be:{ValueUnit}{YourMetricInWordsAction}Per{Interval}.
LikeSystem.InBytesRecvPerSecond.
1.2. "Count" suffix then format should be:{CountUnit}{YourMetric}Count.
LikeCounterPublisher.EventsSentCount. - Values:
2.1. (Value/Interval): Like "bytes in/sec", "Disconnected Peers +/sec".
2.1. (Value): Like "Time Spent In Server: In (ms)". {ValueUnit}AnyThingInPascalCase
Standard units types:
- Seconds
- Microseconds
- Milliseconds
- Bytes
- Kilobytes
- Megabytes
- Gigabytes
- Terabytes
- Bits
- Kilobits
- Megabits
- Gigabits
- Terabits
- Percent
- Count.
Publishing Windows Performance Counters
The native Photon Core writes statistics to Windows Performance Counters (WPC).
Therefore, Photon ships with a separate "CounterPublisher" .NET application, which acts as a kind of proxy: it reads the counters from wherever you like (including Photon's Windows Performance Counters), temporarily adds them to in-memory counters and publishes them.
In addition to the Photon Core Counters, the "CounterPublisher" application reads and broadcasts some Windows System Counters, like the CPU load, memory usage etc.
The "CounterPublisher" application is enabled by default; its behavior can be configured in the "CounterPublisher\bin\CounterPublisher.dll.config".
Under the hood, it is usual ApplicationBase based Photon application with its standard "CounterPublisher" instance with some specially designed Counter classes to be able to read WPC.
"CounterPublisher" application registers 2 counter classes using CounterPublisher.AddStaticCounterClass method:
Photon.CounterPublisher.SystemCounter which reports CPU, Memory and Overall Network Statistics and Photon.CounterPublisher.SocketServerCounter which reports specific to native Photon Core WPC counters including network (UDP, ENET, etc.) and various queues statistics.
To see what counters and values are currently published, DEBUG log level for ExitGames.Diagnostics package must be enforced in "CounterPublisher\bin\log4net.config".
Then, take a look into the log file at "Photon\Log\CounterPublisher.log" (this path specified in configuration of LogFileAppender in "log4net.config"):
XML
  <logger name="ExitGames.Diagnostics">
    <level value="DEBUG" />
  </logger>
Publishing to Graphite
Photon supports Graphite.
The "Writer" is implemented inside ExitGamesLibs.
It can operate over any transport layer: UDP, PGM, HTTP.
Default transport layer for Graphite is UDP.
"ProtocolType" is "GraphiteText".
Sender type is ExitGames.Diagnostics.Configuration.GraphiteTextWriterSettings.
Writer type is ExitGames.Diagnostics.Monitoring.Protocol.Graphite.Text.GraphiteTextWriter.
This is text based protocol.
The format is:
metric_path value timestamp\n
metric_path is in format of PATH[.PATH...] where . is a separator of namespace.
value is float.
timestamp is unix time since epoch in seconds.
Example of protocol data:
Plain Old Text
EU.RACK01.FIRST.System.Cpu 1.53993 1428332168
EU.RACK01.FIRST.System.CpuTotal 2.981617 1428332168
EU.RACK01.FIRST.System.Memory 5317 1428332168
EU.RACK01.FIRST.System.BytesTotalPerSecond 8103.247 1428332168
EU.RACK01.FIRST.System.BytesSentPerSecond 1784.697 1428332168
EU.RACK01.FIRST.System.BytesReceivedPerSecond 6383.81 1428332168
When you use unreliable transport like UDP, it is worth configuring "MaxPayloadSize" property to prevent packet fragmentation during network trips.
Be careful to keep the total length of the payload within your network's MTU.
There is no single good value to use, but here are some guidelines for common network scenarios:
- Fast Ethernet (1432) - This is most likely for Intranets.
- Gigabit Ethernet (8932) - Jumbo frames can make use of this feature much more efficient.
- Commodity Internet (512) - If you are routing over the internet a value in this range will be reasonable
You might be able to go higher, but you are at the mercy of all the hops in your route.
Choose application and modify ".config" like this:
XML
<?xml version="1.0" encoding="utf-8" ?>
<configuration>

  <configSections>
    <section name="Photon" type="Photon.SocketServer.Diagnostics.Configuration.PhotonSettings, Photon.SocketServer"/>
  </configSections>

  <Photon>
    <CounterPublisher enabled="True">
      <Sender
        protocol="GraphiteText"
        endpoint="udp://127.0.0.1:2003"
        senderId="{#CloudType#}.{#PrivateCloud#}.{#Region#}.{#Cluster#}.{0}" />
    </CounterPublisher>
  </Photon>

</configuration>
For this "Graphite" protocol implementation, "senderId" will prepend each metric key published.
Publishing to InfluxDB
Photon supports publishing to InfluxDB using Graphite protocol over UDP.
The Writer is implemented inside ExitGamesLibs.
The main difference between original Graphite protocol is how InfluxDB awaits structured keys.
"ProtocolType" is "InfluxDB090GraphiteText".
Sender type is ExitGames.Diagnostics.Configuration.InfluxDb090TextWriterSettings.
Writer type is ExitGames.Diagnostics.Monitoring.Protocol.InfluxDB090.Graphite.Text.GraphiteTextWriter.
This is text based protocol.
The format is:
metric_path value timestamp\n
metric_path is in format of PATH[.PATH...] where . is a separator of namespace.
value is float.
timestamp is unix time since epoch in seconds.
InfluxDB 0.9.0 awaits keys in the following format:
Plain Old Text
ex: region.us-west.hostname.server01.cpu -> tags -> region: us-west, hostname: server01, point name -> cpu
use senderId = "CloudType.{#CloudType#}.PrivateCloud.{#PrivateCloud#}.Region.{#Region#}.Cluster.{#Cluster#}.Machine.{0}"
Example of protocol data:
Plain Old Text
Region.EU.Rack.RACK01.PC.FIRST.NS.System.Cpu 1.53993 1428332168
Region.EU.Rack.RACK01.PC.FIRST.NS.System.CpuTotal 2.981617 1428332168
Region.EU.Rack.RACK01.PC.FIRST.NS.System.Memory 5317 1428332168
Region.EU.Rack.RACK01.PC.FIRST.NS.System.BytesTotalPerSecond 8103.247 1428332168
Region.EU.Rack.RACK01.PC.FIRST.NS.System.BytesSentPerSecond 1784.697 1428332168
Region.EU.Rack.RACK01.PC.FIRST.NS.System.BytesReceivedPerSecond 6383.81 1428332168
InfluxDB allows you to change . separator to something else using "separator" property.
This separator used to split tags from metric key name.
Keys rewriting can be switched off with "rewriteKeys".
When you use unreliable transport like UDP, it is worth configuring "MaxPayloadSize" property to prevent packet fragmentation during network trips.
Be careful to keep the total length of the payload within your network's MTU.
There is no single good value to use, but here are some guidelines for common network scenarios:
- Fast Ethernet (1432) - This is most likely for Intranets.
- Gigabit Ethernet (8932) - Jumbo frames can make use of this feature much more efficient.
- Commodity Internet (512) - If you are routing over the internet a value in this range will be reasonable.
You might be able to go higher, but you are at the mercy of all the hops in your route.
Choose application and modify ".config" like this:
XML
<?xml version="1.0" encoding="utf-8" ?>
<configuration>

  <configSections>
    <section name="Photon" type="Photon.SocketServer.Diagnostics.Configuration.PhotonSettings, Photon.SocketServer"/>
  </configSections>

  <Photon>
    <CounterPublisher enabled="True">
      <Sender
        protocol="InfluxDB090GraphiteText"
        endpoint="udp://127.0.0.1:2003"
        senderId="CloudType.REALTIME.PrivateCloud.BLAH.Region.LOCAL.Cluster.EY.Machine.{0}" />
    </CounterPublisher>
  </Photon>

</configuration>
For this "Graphite" protocol implementation, "senderId" will prepend each metric key published.
Publishing to StatsD
Photon supports StatsD.
The "Writer" is implemented inside ExitGamesLibs.
It can operate over any transport layer: UDP, PGM, HTTP.
Default transport layer for StatsD is UDP.
"ProtocolType" is "StatsDText".
Sender type is ExitGames.Diagnostics.Configuration.StatsDWriterSettings.
Writer type is ExitGames.Diagnostics.Monitoring.Protocol.StatsD.Text.StatsDTextWriter.
The format of exported metrics is UTF-8 text, with metrics separated by newlines.
Metrics are generally of the form <metric name>:<value>|<type>, with exceptions noted in the metric type.
The protocol allows for both integer and floating point values.
Most implementations store values internally as a IEEE 754 double precision float, but many implementations and graphing systems only support integer values.
For compatibility all values should be integers in the range (-253, 253).
Example of protocol data:
Plain Old Text
REALTIME/PUBLIC/LOCAL/FIRST.System.Cpu:0.472394|c
REALTIME/PUBLIC/LOCAL/FIRST.System.CpuTotal:4.921546|c
REALTIME/PUBLIC/LOCAL/FIRST.System.Memory:5040|c
REALTIME/PUBLIC/LOCAL/FIRST.System.BytesTotalPerSecond:274.1134|c
REALTIME/PUBLIC/LOCAL/FIRST.System.BytesSentPerSecond:247.9789|c
REALTIME/PUBLIC/LOCAL/FIRST.System.BytesReceivedPerSecond:25.77675|c
When you use unreliable transport like UDP, it is worth configuring "MaxPayloadSize" property to prevent packet fragmentation during network trips.
Be careful to keep the total length of the payload within your network's MTU.
There is no single good value to use, but here are some guidelines for common network scenarios:
- Fast Ethernet (1432) - This is most likely for Intranets.
- Gigabit Ethernet (8932) - Jumbo frames can make use of this feature much more efficient.
- Commodity Internet (512) - If you are routing over the internet a value in this range will be reasonable.
You might be able to go higher, but you are at the mercy of all the hops in your route.
Choose application and modify ".config" like this:
XML
<?xml version="1.0" encoding="utf-8" ?>
<configuration>

  <configSections>
    <section name="Photon" type="Photon.SocketServer.Diagnostics.Configuration.PhotonSettings, Photon.SocketServer"/>
  </configSections>

  <Photon>
    <CounterPublisher enabled="True">
      <Sender
        protocol="StatsDText"
        endpoint="udp://127.0.0.1:8125"
        senderId="REALTIME/PUBLIC/LOCAL/{0}" />
    </CounterPublisher>
  </Photon>

</configuration>
For this "StatsD" protocol implementation, "senderId" will prepend each metric key published.
Publishing to NewRelic Platform
The CounterPublisher plugin for NewRelic is available here.
New Relic's SaaS-based application Performance Monitoring helps you build, deploy and maintain great web software.
To publish metrics to NewRelic Platform with "CounterPublisher", there is a separate implementation of writer plugin in CounterPublisher.NewRelic.
It uses native NewRelic SDK
client to call NewRelic's API over HTTP/HTTPS.
To use this plugin, in addition to modification of "CounterPublisher" configuration, copy all the dependencies into the "bin" folder of the application you are trying to configure.
The dependencies include following:
Plain Old Text
config/newrelic.json

CounterPublisher.NewRelic.dll
CounterPublisher.NewRelic.dll.config

NewRelic.Platform.Sdk.dll
Newtonsoft.Json.dll
NLog.dll
ExitGames dependencies that should be provided by the application itself:
Plain Old Text
ExitGames.Logging.Log4Net.dll
ExitGamesLibs.dll
log4net.dll
Sender type is ExitGames.Diagnostics.Configuration.NewRelicAgentSettings.
Writer type is ExitGames.Diagnostics.Monitoring.Protocol.NewRelic.Agent.NewRelicWriter.
Metric data is sent as an HTTP POST of JSON data using this URI:
https://platform-api.newrelic.com/platform/v1/metrics.
The MIME-type for the POST is application/json.
The New Relic Plugins product is optimized to post the data at a frequency of once every 60 seconds.
POST frequency and limitations from the documentation:
- Components: 500 Number of distinct components currently tracked per account.
- Metrics per component: 10,000 Total number of unique metrics per component.
Take precautions to ensure metric names are not generated too dynamically.
Even if the number of metrics being sent in each individual post is small, over time they may add up to a large number of unique metrics.
When the number of metrics for a given component exceeds this limit, the server may start aggregating metrics together by globbing segments of the metric name with an asterisk (*). - Metrics per post: 20,000 Number of metrics sent per post.
A post may send data for multiple components in a single request as long as the total number of metrics in the request does not exceed this limit. - Frequency of post: 2 per minute Frequency of update.
Agents are expected to send data no more frequently than 1 per minute.
To start with it:
- Register NewRelic account.
- Obtain "LicenseKey" in your profile settings (APM -> .NET agent -> Reveal license key)
- Copy dependencies to your application.
Files and instructions can be obtained from the github repository. - Setup configuration.
CounterPublisher.NewRelic Specific Settings
agentId: OPTIONAL.
Default: "com.exitgames.plugins.newrelic.agent".agentName: OPTIONAL.
Default: "".
A human readable string denotes the name of this Agent in the New Relic service.
"{0}" occurrences -if any- will be replaced withEnvironment.MachineName.
If notconfigured or left empty, it will have the following format: "Agent Name: {agentId}. Agent Version: {version}".
So if both agentId and version are also not configured, the agentName will be: "Agent Name: com.exitgames.plugins.newrelic.agent. Agent Version: 1.0.0.".licenseKey: REQUIRED.
Get it from NewRelic (APM -> .NET agent -> Reveal license key).version: OPTIONAL.
Default: "1.0.0".
Note: NewRelic agents are identified by agentId and not by agentName.
Each NewRelic agent can have multiple instances.
Each instance is identified by agentName.
Minimal working NewRelic configuration
XML
  <Photon>
    <CounterPublisher enabled="True" senderType="ExitGames.Diagnostics.Configuration.NewRelicAgentSettings, CounterPublisher.NewRelic">
      <Sender
        protocol="ExitGames.Diagnostics.Monitoring.Protocol.NewRelic.Agent.NewRelicWriter, CounterPublisher.NewRelic"
        licenseKey="YOUR_LICENSE_KEY"
        sendInterval="60" />
    </CounterPublisher>
  </Photon>
Limitations
- sendInterval can't be lower then 60 seconds. This makes the sendInterval setting kind of required for the NewRelic plugin configuration.
- Plugin always send aggregated data over send interval: min, max, sum of sqr, count.
- Plugin do not support metric with empty root namespaces.
- Photon CounterPublisher's counter key format is transformed to NewRelic specific metric name format (
Component/Label[/Attribute/...]).
Publishing to Amazon AWS CloudWatch
The CounterPublisher plugin for AWS CloudWatch is available here.
Amazon CloudWatch is a monitoring service for AWS cloud resources and the applications you run on AWS.
You can use Amazon CloudWatch to collect and track metrics, collect and monitor log files and set alarms.
Amazon CloudWatch can monitor AWS resources such as Amazon EC2 instances,
Amazon DynamoDB tables and Amazon RDS DB instances, as well as custom metrics generated by your applications and services and any log files your applications generate.
You can use Amazon CloudWatch to gain system-wide visibility into resource utilization, application performance and operational health.
You can use these insights to react and keep your application running smoothly.
To publish metrics to Amazon CloudWatch.
with "CounterPublisher", there is a separate implementation of writer plugin in CounterPublisher.AWS.CloudWatch.
It uses native Amazon SDK CloudWatch client to call API over HTTP/HTTPS.
To use this plugin, in addition to modification of "CounterPublisher" configuration, copy all the dependencies into the "bin" folder of the application you are trying to configure.
The dependencies include following:
Plain Old Text
CounterPublisher.AWS.CloudWatch.dll
AWSSDK.CloudWatch.dll
AWSSDK.Core.dll
ExitGames dependencies that should be provided by the application itself:
Plain Old Text
ExitGames.Logging.Log4Net.dll
ExitGamesLibs.dll
log4net.dll
Sender type is ExitGames.Diagnostics.Configuration.AWSCloudWatchSettings.
Writer type is ExitGames.Diagnostics.Monitoring.Protocol.AWS.CloudWatch.AWSCloudWatchWriter.
Amazon CloudWatch associates the data points with the specified metric.
If the specified metric does not exist, Amazon CloudWatch creates the metric.
It can take up to fifteen minutes for a new metric to appear in calls to the list-metrics action.
The size of a put-metric-datarequest is limited to 8 KB for HTTP GET requests and 40 KB for HTTP POST requests.
Although you can publish data points with time stamps as granular as one-thousandth of a second, CloudWatch aggregates the data to a minimum granularity of one minute.
CloudWatch records the average (sum of all items divided by number of items) of the values received for every 1-minute period, as well as number of samples, maximum value and minimum value for the same time period.
To start with it:
- Register Amazon AWS account
- Obtain "AccessKey", "SecretKey" in your profile settings
- Select service url depending on preferred region and CloudWatch custom metrics namespace (i.e. "ExitGames/PhotonServer")
- Copy dependencies to your application.
Files can be obtained from the github repository. - Setup configuration
Limitations:
- Send interval can't be less then 60 seconds.
- Plugin always send aggregated data over send interval: min, max, sum of sqr, count.
- Plugin do not support metric with empty root namespaces.
- Plugin tries to detect unit type based on common data size types and "Per" suffix for
choosing interval measures. - It is important, to choose metrics names wisely (which usually:
[Namespace.]Key).
Refer to the rules in Counters Schemas for naming conventions and proper formatting of counters.
Choose application and modify ".config" file like this:
XML
<?xml version="1.0" encoding="utf-8" ?>
<configuration>

  <configSections>
    <section name="Photon" type="Photon.SocketServer.Diagnostics.Configuration.PhotonSettings, Photon.SocketServer"/>
  </configSections>

  <Photon>
    <CounterPublisher
        enabled="True"
        senderType="ExitGames.Diagnostics.Configuration.AWSCloudWatchSettings, CounterPublisher.AWS.CloudWatch">

      <Sender
        protocol="ExitGames.Diagnostics.Monitoring.Protocol.AWS.CloudWatch.AWSCloudWatchWriter, CounterPublisher.AWS.CloudWatch"
        senderId="{#CloudType#}/{#PrivateCloud#}/{#Region#}/{#Cluster#}/{0}"

        awsCloudWatchAccessKey = "..."
        awsCloudWatchSecretKey = "..."
        awsCloudWatchServiceUrl = "..."
        awsCloudWatchNamespace = "..."

        sendInterval="60" />
    </CounterPublisher>
  </Photon>

</configuration>
For this "CloudWatch" protocol implementation, "senderId" will dimension each metric key published.
Implementing custom performance counters
On architecture details take a look at Usage/Counter schemas.
At first, your application needs to track the desired values.
We are going to use the in-memory counters from ExitGames.Diagnostics.Counter for this purpose.
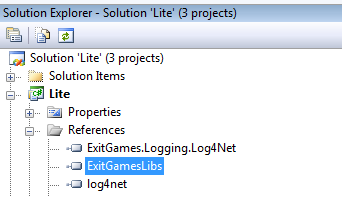
Make sure that your application has a reference to "libs\ExitGamesLibs.dll":
Counter Declaration
The next step is to create a counter definition class.
Add "using"-directives for ExitGames.Diagnostics.Counter and ExitGames.Diagnostics.Monitoring and declare your custom counter like shown below.
Add a PublishCounter attribute with a unique name; this makes sure that the counter value will be published by the the counter publisher (see below).
C#
using ExitGames.Diagnostics.Counter;
using ExitGames.Diagnostics.Monitoring;

public static class MyCustomCounter
{
  [PublishCounter("MessagesPerSecond")]
  public static readonly CountsPerSecondCounter MessagesPerSecond = new CountsPerSecondCounter();
}
Refer to the rules in Counters Schemas for naming conventions and proper formatting of counters.
Counter Usage
In the appropriate place in your code, increment or decrement the counter.
For example, to count the number of sent messages per second, add the following code to the method that handles your SendMessage operation:
C#
protected virtual void HandleSendMessageOperation(LitePeer peer, OperationRequest operationRequest)
{
  // [... operation logic ...]

  // increment performance counter:
  MyCustomCounter.MessagesPerSecond.Increment();
}
That's all.
You have done everything that is required to collect your performance data now.
Counter Publisher Initialisation
The next step is to publish the collected performance data.
For this, you need to initialize a "CounterPublisher" during the start-up of our application.
The "Setup" method of your application is a good place for this.
This example shows how to initialize the counter publisher and add your custom counter definition class.
You can choose an arbitrary name for the second parameter.
It's used as the category in which the counter will be displayed by the dashboard later.
C#
protected override void Setup()
{
  // [... setup logic  ...]

  // initialize counter publisher and add your custom counter class(es):
  if (PhotonSettings.Default.CounterPublisher.Enabled)
  {
    CounterPublisher.DefaultInstance.AddStaticCounterClass(typeof(MyCustomCounter), "MyApplication");
    CounterPublisher.DefaultInstance.Start();
  }
}
or you can extended any .NET Photon application configuration to publish those in-memory metrics via <Counters/Schema> configuration element.
XML
  <Photon>
    <CounterPublisher ... >
      <Sender  ... />
        <Counters>
          <Schema namespace="MyApplication" type="...MyCustomCounter, YOUR_LIB_NAME" />
        </Counters>
    </CounterPublisher>
  </Photon>
Counter Publisher Configuration
The last step is to add the appropriate configuration for the counter publisher.
Configure it to send data to the IP / Port where your time series database is running.
Remember, that multicasting is only working in the same subnet; to publish performance data between different networks, use the concrete IP and make sure that the port is opened up in the firewall.
Take a look on any of Usage topics of this manual.
Example:
XML
<?xml version="1.0" encoding="utf-8" ?>
<configuration>

  <configSections>
    <section name="Photon" type="Photon.SocketServer.Diagnostics.Configuration.PhotonSettings, Photon.SocketServer"/>
  </configSections>

  <Photon>
    <CounterPublisher enabled="True">
      <Sender
        protocol="PhotonBinary"
        endpoint="udp://127.0.0.1:40001"
        senderId="servers/Realtime/Public/Local/Test/{0}" />

      <Counters>
        <Schema namespace="MyApplication" type="...MyCustomCounter, YOUR_LIB_NAME" />
      </Counters>
    </CounterPublisher>
  </Photon>

</configuration>
Implementing custom protocol
To take better understanding on how it can be done, take a look at:
CounterPublisher.AWS.CloudWatch project, CounterPublisher.NewRelic project, Application protocols topic.
The basic idea of implementing custom application protocol
is to create a separate .NET library (dll) and:
- Implement settings class extension if needed based on
ExitGames.Diagnostics.Configuration.CounterSampleSenderSettings. - Implement Writer interface
ExitGames.Diagnostics.Monitoring.Protocol.ICounterSampleWriterwhich is main entry point. - Provide sample configuration to your "App.config" file.
Counter writer interface
ExitGames.Diagnostics.Monitoring.Protocol.ICounterSampleWriter is the main entry point into protocol plugin.
There is a basic abstract implementation of this "Writer" ExitGames.Diagnostics.Monitoring.Protocol.PhotonBinaryWriterBase which provides additional queue to aggregate super sampled data.
Implement ICounterSampleWriter methods:
C#
public interface ICounterSampleWriter : IDisposable
{
    /// <summary>
    ///   Is writer ready to publish any data.
    ///   IsConnected status is subset of this status.
    ///   Default implementation is writer started and connected.
    /// </summary>
    bool Ready { get; }

    /// <summary>
    ///   Start writing.
    ///   Stop is handled by IDisposable implementation.
    ///   Can be called once.
    /// </summary>
    void Start(CounterSampleSenderBase sender);

    /// <summary>
    ///    Called by <see cref="CounterSampleSenderBase"/>
    ///    to write samples out to some storage.
    /// </summary>
    void Publish(CounterSampleCollection[] packages);
}
Configuration
The basic configuration class is ExitGames.Diagnostics.Configuration.CounterSampleSenderSettings.
You can extend it if some additional parameters are required to be setted up for the "Writer".
C#
public class InfluxDB090TextWriterSettings : GraphiteTextWriterSettings
{
    /// <summary>
    ///   Do rewriting of keys provided by sampler to keep them distinct to tags part of the path.
    /// </summary>
    [ConfigurationProperty("rewriteKeys", IsRequired = false, DefaultValue = true)]
    public bool RewriteKeys
    {
        get
        {
            return (bool)this["rewriteKeys"];
        }
        set
        {
            this["rewriteKeys"] = value;
        }
    }

    /// <summary>
    ///   Separator used by InfluxDB instead of default DOT(.).
    /// </summary>
    [ConfigurationProperty("separator", IsRequired = false, DefaultValue = '.')]
    public char Separator
    {
        get
        {
            return (char)this["separator"];
        }
        set
        {
            this["separator"] = value;
        }
    }

    public InfluxDB090TextWriterSettings() { }

    public InfluxDB090TextWriterSettings(CounterSampleSenderSettings settings) : base(settings) { }
}
Usage
To use plugin:
- Copy dependencies to the application.
- Setup configuration with valid "Writer" type and "Configuration" when needed.
Example:
XML
<?xml version="1.0" encoding="utf-8" ?>
<configuration>

  <configSections>
    <section name="Photon" type="Photon.SocketServer.Diagnostics.Configuration.PhotonSettings, Photon.SocketServer"/>
  </configSections>

  <Photon>
    <CounterPublisher enabled="True">
      <Sender
        protocol="InfluxDB090GraphiteText"
        endpoint="udp://127.0.0.1:2003"
        senderId="CloudType.REALTIME.PrivateCloud.BLAH.Region.LOCAL.Cluster.EY.Machine.{0}" />
    </CounterPublisher>
  </Photon>

</configuration>
Troubleshooting
Is the counter publishing enabled? Check the configuration of your application. i.e. "deploy\CounterPublisher\bin\CounterPublisher.dll.config".
Check the Photon logs files at "\deploy\log*" for errors and destination database log files.
Make sure data is publishing out in logs (set DEBUG in log4net to
ExitGames.Diagnostics):
To see what counters and values are currently published,DEBUGlog level forExitGames.Diagnosticspackage must be enforced in "{appname}\bin\log4net.config".
Then, go to take a look into log file at "Photon\Log{appname}.log" (this path specified in configuration of LogFileAppender in "log4net.config"):XML
<logger name="ExitGames.Diagnostics">
  <level value="DEBUG" />
</logger>
Make sure that the appropriate ports are open in the firewall.
Check packets ip / port source / destinations using sniffer and
netstat.Check destination database receives packets using sniffer and extended log levels.
Check format of data / protocol is good inspecting data packets.
Make sure data is publishing out in packets (use wireshark sniffer).
List of counters from ExitGames.Diagnostics.Counter
This section discusses the available types of in-memory counters from the ExitGames.Diagnostics.Counter namespace in greater detail.
All counters implement the ICounter interface:
C#
namespace ExitGames.Diagnostics.Counter
{
    public interface ICounter
    {
        string Name { get; }

        // Gets the type of the counter.

        CounterType CounterType { get; }

        // Gets the next value.
        float GetNextValue();

        // Increments the counter by one and returns the new value.
        long Increment();

        // Increments the counter by a given value and returns the new value.
        long IncrementBy(long value);

        // Decrements the counter by one and returns the new value.
        long Decrement();
    }
}
As you see, there are mainly methods to increment / decrement the counter value.
GetNextValue is the method to return the actual "value" of the counter.
This can be a calculated value - for example, when you call GetNextValue on an AverageCounter, the counter calculates the average of all increments / decrements since the previous call to GetNextValue
and returns that value.
GetNextValue resets internal values - you should never call it in your code manually, otherwise the published data will be incorrect.
The "CounterPublisher" makes calls to GetNextValue
at regular intervals.
NumericCounter
This is a very straight-forward counter.
It holds a single value; GetNextValue returns that single value and does not reset the counter.
Example: At the start of a 10-second-interval, the NumericCounter has a value of 5.
It is incremented 2 times, with values of 1 and 6 and decremented once with a value of 3, resulting in a value of 5+1+6-3 = 9 for this interval.
Typical use-case: The number of users that are currently logged on to your system.
C#
public void AddToCache(ArrayList items)
{
   foreach (var item in items)
   {
     Cache.Insert(item);
   }

   MyCacheItemCounter.IncrementBy(items.Count);
}

public void RemoveFromCache(ArrayList items)
{
   foreach (var item in items)
   {
     Cache.Remove(item);
   }

   MyCacheItemCounter.IncrementBy( -items.Count);
}

// When the CounterPublisher calls MyCacheItemCounter.GetNextValue(), it always returns the current number of items in cache.
AverageCounter
The AverageCounter tracks how often it was called since the last reset and can be incremented by any value.
It returns the average amount per call in the current interval (= total amount / # of calls).
Example: In a 10-second-interval, the AverageCounter is incremented 4 times, with values of 1,2,4,5.
This is 12 in total, resulting in an average of 12/4 = 3 for this interval.
Typical use-case:
The average execution time of a certain operation, or the average text length per sent message.
C#
public void WinGame(Player player, int coins)
{
   player.Account.Add(coins);

   AverageCoinsWonCounter.IncrementBy(coins);
}

public void LoseGame(Player player, int coins)
{
   player.Account.Remove(coins);

   AverageCoinsWonCounter.IncrementBy( -coins);
}

// When the CounterPublisher calls AverageCoinsWonCounter.GetNextValue(), it returns the average amount a player has won in the interval since the previous call to GetNextValue().
// This amount might as well be negative. The internal counter value is reset afterwards - i.e., if no Game was won or lost between two calls to GetNextValue(), the average is 0.
CountsPerSecondCounter
The CountsPerSecondCounter holds a single value, which can be incremented / decremented by any value.
It returns the average amount per second in the last interval.
You only need to increment / decrement the counter, it converts these calls in "per second" values automatically.
Example: In a 10-second-interval, the CountsPerSecondCounter is incremented 3 times, with values of 10, 20 and 70.
This is 100 in total, resulting in a value of 10 per second for this interval.
Typical use-case: The number of sent bytes per second on a network
interface, or the number of times a specific action is taken per second.
C#
public void RaiseEvent()
{
   // do something to raise an event

   EventsPerSecondCounter.Increment();
}

// RaiseEvent can be called at any time - multiple times per second, or only once every few seconds and requires no fixed interval.
// When the CounterPublisher calls EventsPerSecondCounter.GetNextValue(), the counter checks how many seconds have passed since the the last call to GetNextValue().
// It calculates its return value as  "CurrentValue  / SecondsPassed".  The internal value is reset when GetNextValue() is called.
PerformanceCounterReader
The purpose of the PerformanceCounterReader is to read values from underlying Windows performance counters.
It is a read-only counter and can not be incremented / decremented.
This is failsafe, i.e. no errors are thrown if the performance counter does not exist or access is not allowed.
WindowsPerformanceCounter
The WindowsPerformanceCounter is a wrapper class for Windows performance counters; it provides read / write access to the underlying counter.
The performance counter need to exist and the reading / writing application needs to have the appropriate rights, otherwise an exception is raised.
For more information on Windows performance counters, MSDN is a good starting point.
Back to top- Performance Counters
- Usage
- Overview
- Architecture
- Configuration
- Transport protocols
- Application Protocols
- Counters schemas
- Publishing Windows Performance Counters
- Publishing to Graphite
- Publishing to InfluxDB
- Publishing to StatsD
- Publishing to NewRelic Platform
- Publishing to Amazon AWS CloudWatch
- Implementing custom performance counters
- Implementing custom protocol
- Troubleshooting
- List of counters from ExitGames.Diagnostics.Counter